Syncfusion provides a large range of controls for angular https://www.syncfusion.com/angular-ui-components
There is a community version of the controls https://www.syncfusion.com/products/communitylicense
So I played around and managed to get it working I'm not a angular developer but have used Syncfusion in Lightswitch.
Here is the steps I took you should be able to get this up and going in
- Have NodeJS installed
- Create a Radzen angular application and add a page
- Run the application so that it generates its code and stop it
- Start the command prompt and go to radzen-app-dir\client
- Install the Charts by running the following command npm install @syncfusion/ej2-angular-charts --save
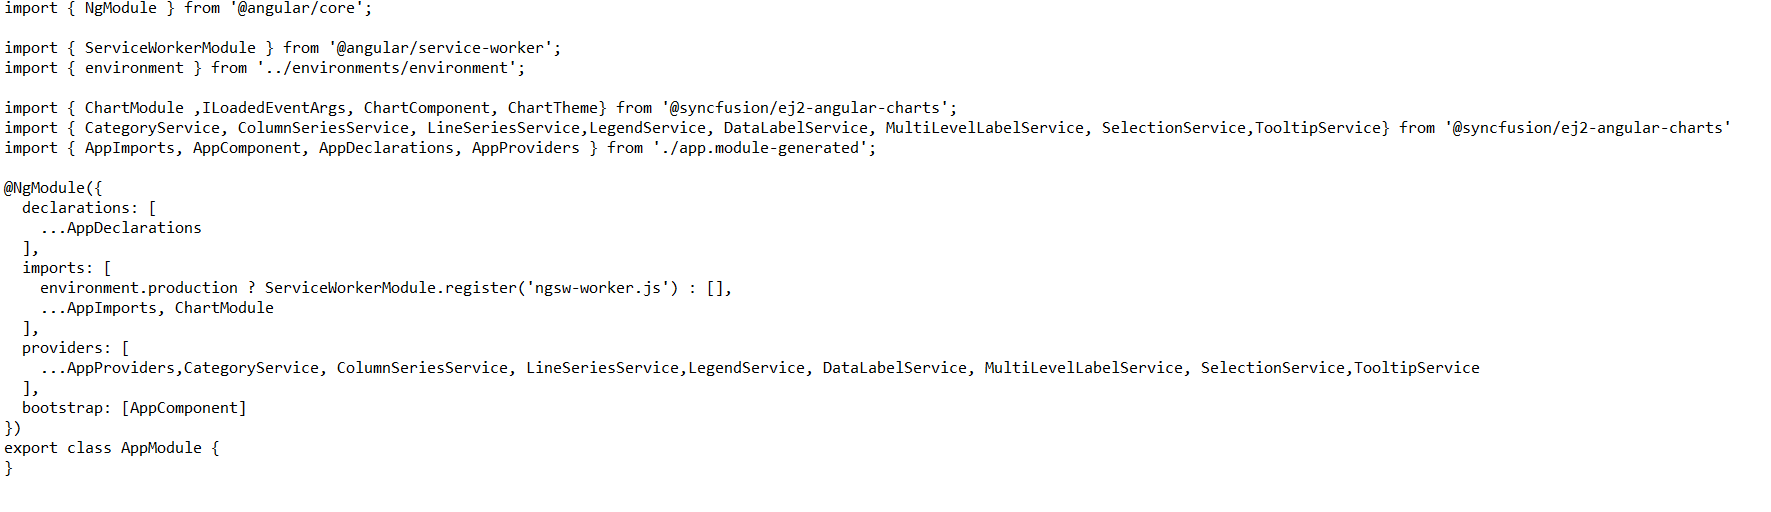
- Open app.module.ts in notepad it is in the following path radzen-app-dir\client\src\app\app.module.ts
- Add the following to the file and save it
At the top add
import { ChartModule ,ILoadedEventArgs, ChartComponent, ChartTheme} from '@syncfusion/ej2-angular-charts';
import { CategoryService, ColumnSeriesService, LineSeriesService,LegendService, DataLabelService, MultiLevelLabelService, SelectionService,TooltipService} from '@syncfusion/ej2-angular-charts'
under @NgModule
imports: add ,ChartModule
providers add ,CategoryService, ColumnSeriesService, LineSeriesService,LegendService, DataLabelService, MultiLevelLabelService, SelectionService,TooltipService
It should look something like this
- In Radzen create a Odata dataSource and select the sample odata source
- Go to the page event and add a event handler to the load event and set it to Invoke data source method. Set Name to getProducts. Add the Then handler and set Type to Set property,Name to products and Value to ${result.value}.
- Drag and drop a Html component
- add the following code to it
   <e-series  [dataSource]='products'   type= 'Column'  name='Products' width='3'    xName='Id'  yName='ProductPrice' ></e-series>

   </e-series-collection>
</ejs-chart>
You now have a working Chart

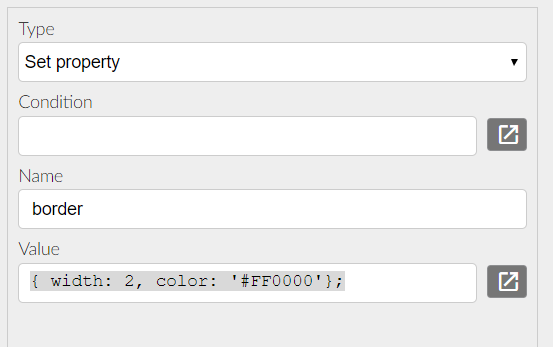
I also wanted to try setting some properties of the chart control.
Here is how you add a border
In the page events Set a property called border to { width: 2, color: '#FF0000'};
Paste the following code into the html control replacing what was there
<ejs-chart id="chart-container" style='display:block' align='center' [border]='border' title='Syncfusion Bar Chart' >
You should now get a red border

   <e-series  [dataSource]='products'   type= 'Column'  name='Products' width='3'    xName='Id'  yName='ProductPrice' ></e-series>

   </e-series-collection>
</ejs-chart>
