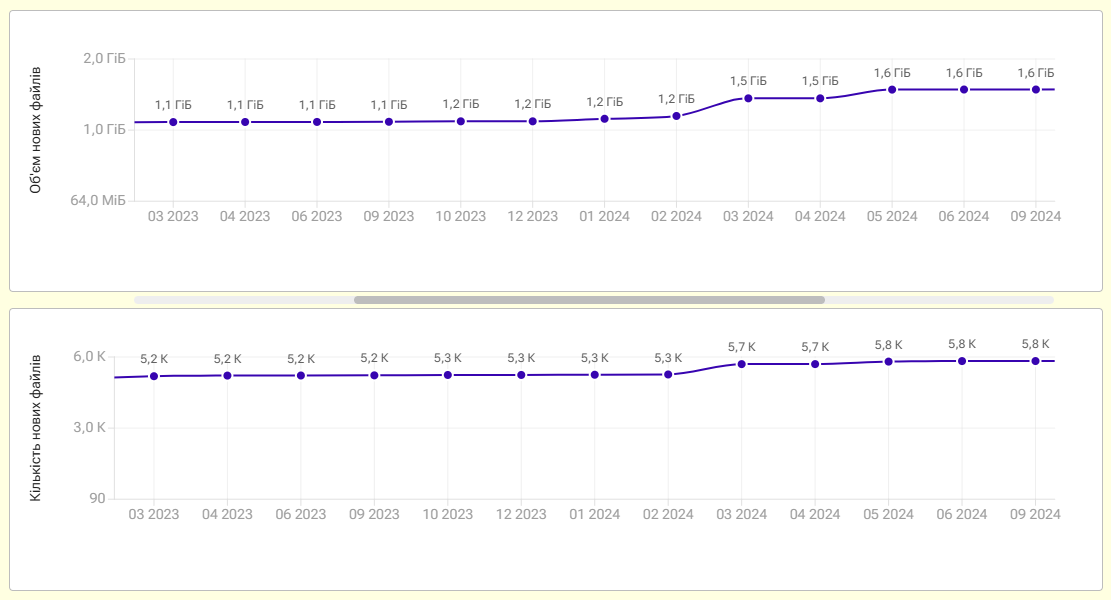
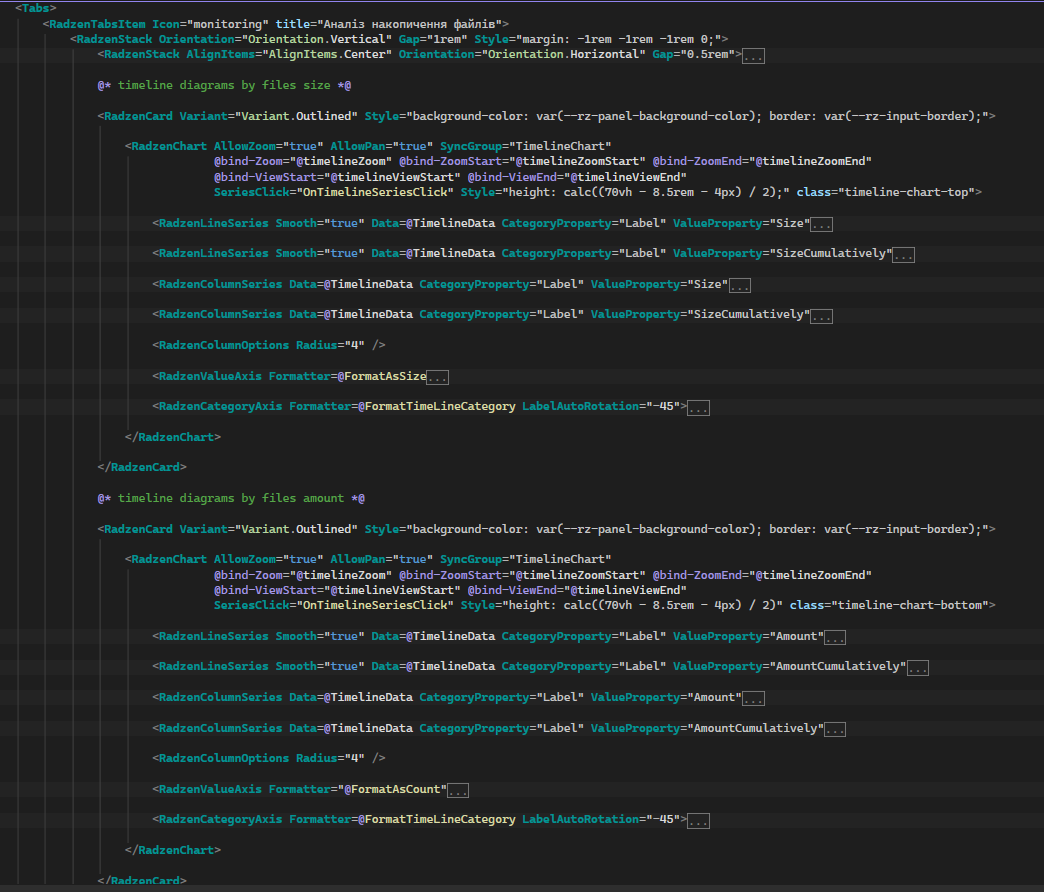
I'm trying to implement a function for synchronous zooming and panning for two charts that have the same values on the category axis. To do this I sync values for the properties Zoom, ZoomStart, ZoomEnd, ViewStart and ViewEnd. All work as expected, however, I have two scrollbars, one on each chart. Using CSS I hid the scrollbar for the second chart and moved the scroll bar from the first chart into the space between these charts. The result looks like this:
My problem is that I can't make room for the scroll bars on both charts. Is there any way to resolve this issue in the current implementation of the library (11.4)?
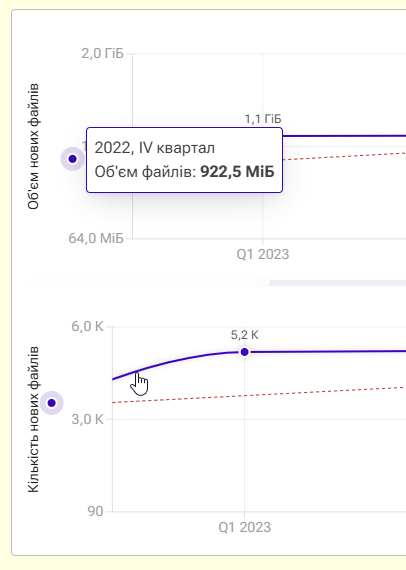
Another issue I discovered: when I used a synchronization group for these two charts, the tooltips for identical data points weren't always displayed simultaneously. Perhaps this has something to do with the different sizes of the category axes.
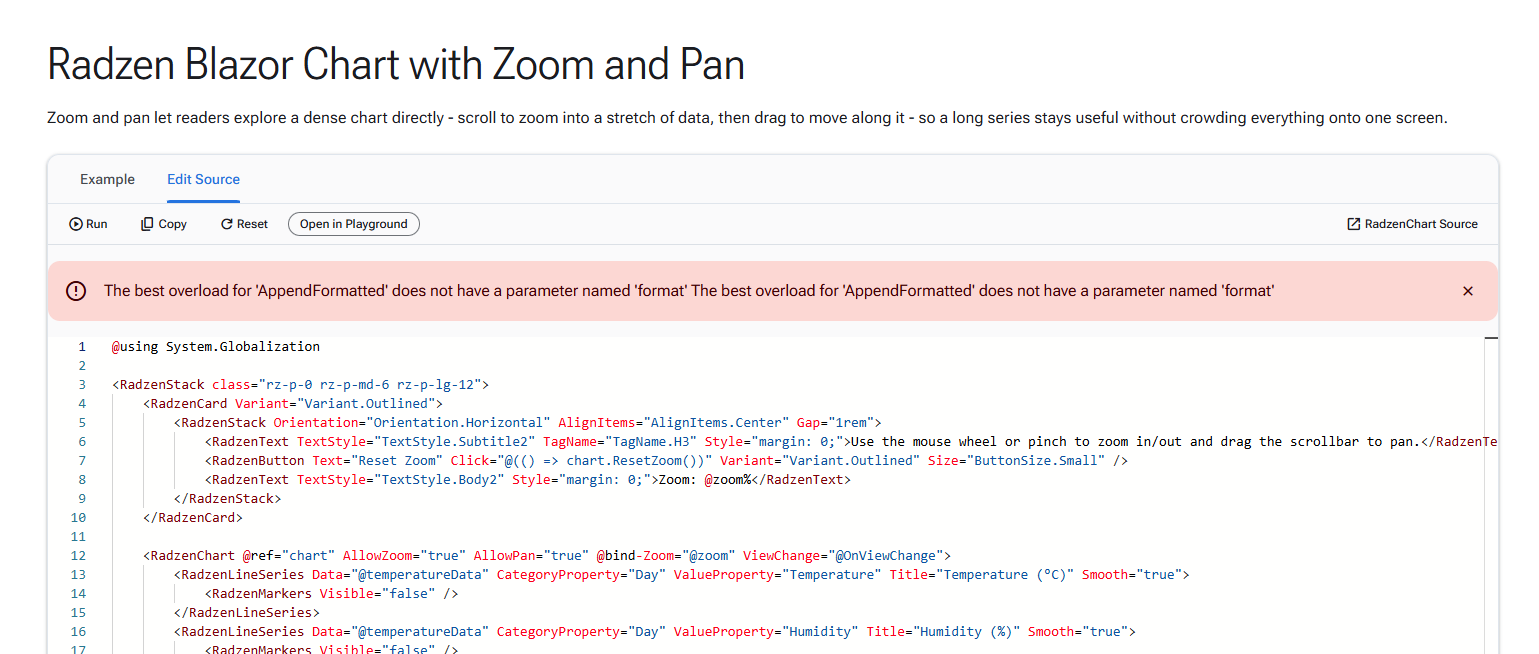
And the final issue is related to the demo areas for Radzen Blazor Chart with Zoom and Pan and Radzen Blazor Range Navigator. In case if try to run the source codes even without modification you can see an error:
Thanks for the detailed report - all three points are addressed and pushed to master; they will be part of the next release next week.
Scrollbar outside the chart - RadzenChart now has a ShowScrollbar parameter. Set ShowScrollbar="false" on both charts (keep AllowZoom/AllowPan) so they neither draw their own scrollbar nor reserve space for it, and place one standalone RadzenRangeNavigator between them bound to the same values as the charts' @bind-ViewStart / @bind-ViewEnd. The mouse wheel still zooms and the navigator follows. There is a new "Synchronized Charts" example on the Range Navigator demo page showing exactly this setup.
Tooltips not shown simultaneously with a sync group - this was a bug. The sync group registry was shared across the whole server process, so with more than one circuit open (another user, another tab, or a recently closed one) hovers leaked between sessions and the hovered chart's tooltip froze on a stale point. Sync groups are now scoped per circuit.
"AppendFormatted ... parameter named 'format'" when running the demo source - also a bug, in the demo site's trimming configuration. The published site stripped parameter names the online compiler relies on for {value:F2} style interpolations. Fixed; the demos will compile online again after the next deployment.
As for tooltips synchronization in my app (it just something like cloud file storage data analysis). I rebuild it with the library version 11.4.2 and attached a short video how it actually works. Perhaps this behavior is somehow related to the active use of nested dialogs.
One more interesting effect with chart’s tooltips: tooltips are displayed for values that fall outside the specified range. Is this by design, or is it a bug?