Mz_Gh
September 24, 2023, 12:06pm
1
I have an application that I need its chart to be like this link from AccuWeather:
AccuWeather
I tried alot to designate a base for the chart using:
<RadzenValueAxis Min="@(weathers.Min(w => w.LowTemp))">
But the chart does not appear correctly. Is there a way in Radzen Blazor to do this?
korchev
September 24, 2023, 1:18pm
2
If you use Min to set the Min axis value any item with that Min value won't appear. It should be less than the minimum possible value. So I would try with something like <RadzenValueAxis Min="@(weathers.Min(w => w.LowTemp) - 10)">
Mz_Gh
September 24, 2023, 7:50pm
3
The problem is direction of the min temp, either using `Min="@(weathers.Min(w => w.LowTemp) - 10)" the base is still zero. only direction of the min temp is then downward.
korchev
September 25, 2023, 4:55am
4
I am afraid I don't understand that. We will need a reproduction of the issue in order to help you further.
Mz_Gh
September 25, 2023, 5:56am
5
The following is part of the app:
<RadzenChart>
    <RadzenStackedColumnSeries Data="weathers2.Where(w => w.LowTemp != null)" CategoryProperty="Date" Title="Low Temp"
                               ValueProperty="LowTemp" Fill="#2ca0d8" Stroke="#2ca0d8">
        <ChildContent>
            <RadzenMarkers MarkerType="MarkerType.Circle" />
        </ChildContent>
    </RadzenStackedColumnSeries>
    <RadzenStackedColumnSeries Data="weathers2.Where(w => w.HighTemp != null)"
                               CategoryProperty="Date"
                               Title="High Temp" ValueProperty="HighTemp" Fill="#f59721"
                               Stroke="#f59721" TItem="Data.Entities.Weather">

        <ChildContent>
            <RadzenMarkers MarkerType="MarkerType.Circle" />
        </ChildContent>
    </RadzenStackedColumnSeries>
    <RadzenCategoryAxis Padding="10" Formatter="FormatDate">
    </RadzenCategoryAxis>
    <RadzenValueAxis Min="@(weathers.Min(w => w.LowTemp) - 10)">
        <RadzenGridLines Visible="true" Stroke="#f2f2f2" LineType="LineType.Solid" StrokeWidth="1" />
        <RadzenAxisTitle Text="Temperature" />
    </RadzenValueAxis>
</RadzenChart>

@code{
...
async Task LoadData(LoadDataArgs args)
{
    var query = context.Weathers.Include(w => w.SecondaryConditions).Include(w => w.MzJobs)
        .ThenInclude(jw => jw.MzJob).AsQueryable();


    if (!string.IsNullOrEmpty(args.Filter))
    {
        // Filter via the Where method
        query = query.Where(args.Filter);
    }

    if (!string.IsNullOrEmpty(args.OrderBy))
    {
        // Sort via the OrderBy method
        query = query.OrderBy(args.OrderBy);
    }
    else
    {
        query = query.OrderByDescending(w => w.Date);
    }

    count = query.Count();

    weathers = query.Skip(args.Skip.Value).Take(args.Top.Value).ToList<Data.Entities.Weather>();

    weathers2.Clear();
    weathers.ForEach(w => weathers2.Add(new Data.Entities.Weather()
    {
        Id = w.Id,
        Date = w.Date,
        HighTemp = w.HighTemp - w.LowTemp,
        LowTemp = w.LowTemp, // when LowTemp is minus its direction is downward starting from zero
        AQI = w.AQI,
        MzJobs = w.MzJobs,
        MainConditionID = w.MainConditionID,
        AQIID = w.AQIID,
        AQINumber = w.AQINumber,
        Notes = w.Notes,
        MainCondition = w.MainCondition,
        SecondaryConditions = w.SecondaryConditions,
        WindSpeed = w.WindSpeed
    }));
}
List<Data.Entities.Weather> weathers2 = new List<Data.Entities.Weather>();
...
}
for minus degrees the base still zero but direction of min temp is downward.
korchev
September 25, 2023, 6:20am
6
I am afraid this isn't a snippet that we can run as it depends on a database. Please use static data as in our demo page .
Mz_Gh
September 25, 2023, 7:10am
7
---------------- Data --------------------
date1: High: 20 - Low: 15
date2: High: 24 - Low: 18
date3: High: 18 - Low: 7
date4: High: 20 - Low: -5 << minus low temp causes to start from zero and go downward

--------------- inside .razor page method)--------------------
weathers2.Clear();
weathers.ForEach(w => weathers2.Add(new Data.Entities.Weather()
{
    Id = w.Id,
    Date = w.Date,
    HighTemp = w.HighTemp - w.LowTemp,
    LowTemp = w.LowTemp
}
------------------ .razor page field  -------------------
List<Data.Entities.Weather> weathers2 = new List<Data.Entities.Weather>();
----------------- Entity --------------------
[Table("Weathers", Schema = "weather")]
public class Weather
{
    public int Id { get; set; }
    public DateTime Date { get; set; } // between boxes
    public int? HighTemp { get; set; } // between boxes
    public int? LowTemp { get; set; } // between boxes

}
korchev
September 25, 2023, 7:32am
8
This is again not something that we can run. I give up - probably somebody else from the community understands your case.
Mz_Gh
September 25, 2023, 8:44am
9
I created a .razor file for test just copy and paste the following to a .razor and run:
@page "/comp3"

<RadzenChart>
    <RadzenStackedColumnSeries Data="weathers2.Where(w => w.LowTemp != null)" CategoryProperty="Date" Title="Low Temp"
                               ValueProperty="LowTemp" Fill="#2ca0d8" Stroke="#2ca0d8">
        <ChildContent>
            <RadzenMarkers MarkerType="MarkerType.Circle" />
        </ChildContent>
    </RadzenStackedColumnSeries>
    <RadzenStackedColumnSeries Data="weathers2.Where(w => w.HighTemp != null)"
                               CategoryProperty="Date"
                               Title="High Temp" ValueProperty="HighTemp" Fill="#f59721"
                               Stroke="#f59721" TItem="Weather">

        <ChildContent>
            <RadzenMarkers MarkerType="MarkerType.Circle" />
        </ChildContent>
    </RadzenStackedColumnSeries>
    <RadzenCategoryAxis Padding="10">
    </RadzenCategoryAxis>
    <RadzenValueAxis Min="@(weathers.Min(w => w.LowTemp) - 10)">
        <RadzenGridLines Visible="true" Stroke="#f2f2f2" LineType="LineType.Solid" StrokeWidth="1" />
        <RadzenAxisTitle Text="Temperature" />
    </RadzenValueAxis>
</RadzenChart>


@code {

    protected override void OnInitialized()
    {
        base.OnInitialized();

        Load();
    }

    List<Weather> weathers = new List<Weather>()
    {
     new Weather(){ Id = 1, Date = new DateTime(2022, 2, 5), HighTemp = 20, LowTemp = 15 },
     new Weather(){ Id = 2, Date = new DateTime(2022, 2, 10), HighTemp = 24, LowTemp = 18 },
     new Weather(){ Id = 3, Date = new DateTime(2022, 2, 14), HighTemp = 18, LowTemp = 7 },
     new Weather(){ Id = 4, Date = new DateTime(2022, 2, 22), HighTemp = 20, LowTemp = -5 },
    };

    List<Weather> weathers2 = new List<Weather>();

    void Load()
    {
        weathers2.Clear();
        weathers.ForEach(w => weathers2.Add(new Weather()
        {
            Id = w.Id,
            Date = w.Date,
            HighTemp = w.HighTemp - w.LowTemp,
            LowTemp = w.LowTemp
        }));
    }

    public class Weather
    {
        public int Id { get; set; }
        public DateTime Date { get; set; } // between boxes
        public int? HighTemp { get; set; } // between boxes
        public int? LowTemp { get; set; } // between boxes

    }


}
korchev
September 25, 2023, 9:42am
10
That's better.
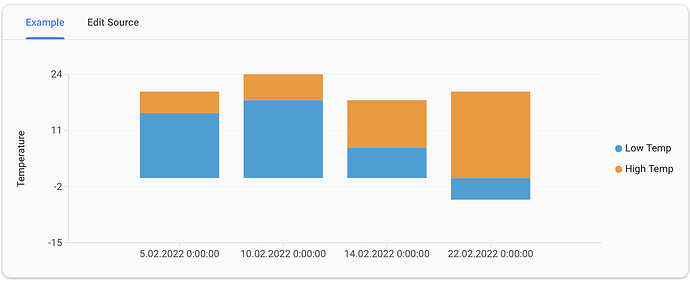
I've made a few changes (converted the DateTime property to string to prevent category axis interpolation as it doesn't seem needed in your case). I am also using the yet unreleased version of Radzen.Blazor which contains a fix for a stacked column chart bug (to be released by the end of the week). Here are the results I got:
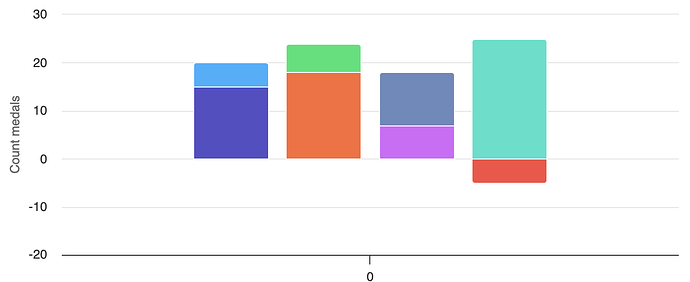
I also tested how the Chart Market leader behaves with your data and got similar results.
Here is the code I tested with:
<RadzenChart>
    <RadzenStackedColumnSeries Data="weathers2.Where(w => w.LowTemp != null)" CategoryProperty="Date" Title="Low Temp"
                               ValueProperty="LowTemp" Fill="#2ca0d8" Stroke="#2ca0d8">
        <ChildContent>
            <RadzenMarkers MarkerType="MarkerType.Circle" />
        </ChildContent>
    </RadzenStackedColumnSeries>
    <RadzenStackedColumnSeries Data="weathers2.Where(w => w.HighTemp != null)"
                               CategoryProperty="Date"
                               Title="High Temp" ValueProperty="HighTemp" Fill="#f59721"
                               Stroke="#f59721" TItem="Weather">

        <ChildContent>
            <RadzenMarkers MarkerType="MarkerType.Circle" />
        </ChildContent>
    </RadzenStackedColumnSeries>
    <RadzenCategoryAxis Padding="10">
    </RadzenCategoryAxis>
    <RadzenValueAxis Min="@(weathers.Min(w => w.LowTemp) - 10)">
        <RadzenGridLines Visible="true" Stroke="#f2f2f2" LineType="LineType.Solid" StrokeWidth="1" />
        <RadzenAxisTitle Text="Temperature" />
    </RadzenValueAxis>
</RadzenChart>


@code {

    protected override void OnInitialized()
    {
        base.OnInitialized();

        Load();
    }

    List<Weather> weathers = new List<Weather>()
    {
     new Weather(){ Id = 1, Date = new DateTime(2022, 2, 5).ToString(), HighTemp = 20, LowTemp = 15 },
     new Weather(){ Id = 2, Date = new DateTime(2022, 2, 10).ToString(), HighTemp = 24, LowTemp = 18 },
     new Weather(){ Id = 3, Date = new DateTime(2022, 2, 14).ToString(), HighTemp = 18, LowTemp = 7 },
     new Weather(){ Id = 4, Date = new DateTime(2022, 2, 22).ToString(), HighTemp = 20, LowTemp = -5 },
    };

    List<Weather> weathers2 = new List<Weather>();

    void Load()
    {
        weathers2.Clear();
        weathers.ForEach(w => weathers2.Add(new Weather()
        {
            Id = w.Id,
            Date = w.Date,
            HighTemp = w.HighTemp - w.LowTemp,
            LowTemp = w.LowTemp
        }));
    }

    public class Weather
    {
        public int Id { get; set; }
        public string Date { get; set; } // between boxes
        public int? HighTemp { get; set; } // between boxes
        public int? LowTemp { get; set; } // between boxes

    }
}
Mz_Gh
September 25, 2023, 10:16am
11
So as I understand, with radzen I can't create a chart that looks like the chart in accuweather.
korchev
September 25, 2023, 11:21am
12
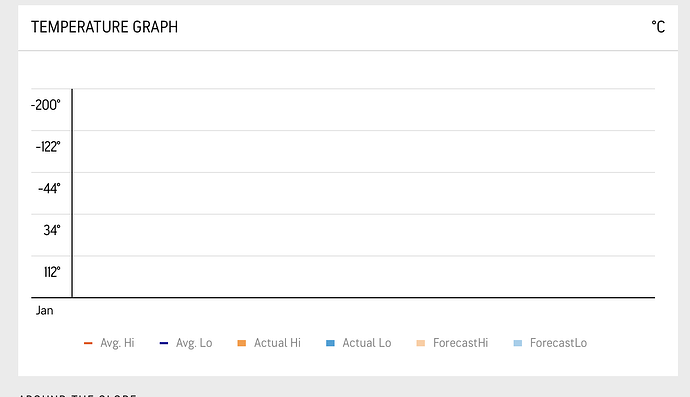
How does that chart look like? Right now the chart on the linked site looks like this:
Which is totally achievable with RadzenChart
korchev
September 25, 2023, 12:29pm
14
Indeed such chart is not supported at the moment - RadzenChart will invert negative values as it is commonly done. You can however achieve something similar by making all values positive (for example by adding 100 to all). Then use the template for the tooltip and value axis and display the actual values (by substracting 100).
Mz_Gh
September 25, 2023, 12:32pm
15
As I see many charts including radzen and apexcharts don't support this. so I have no complain since your charts are standard. Thank you for your time replying my questions.


