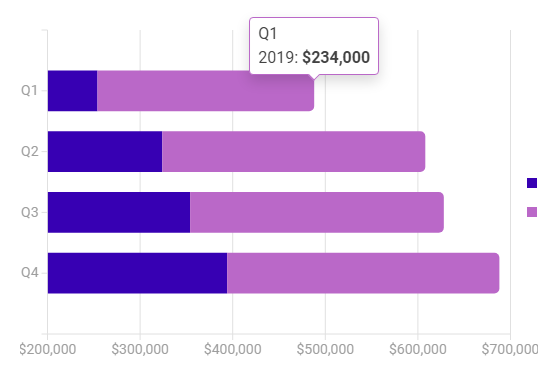
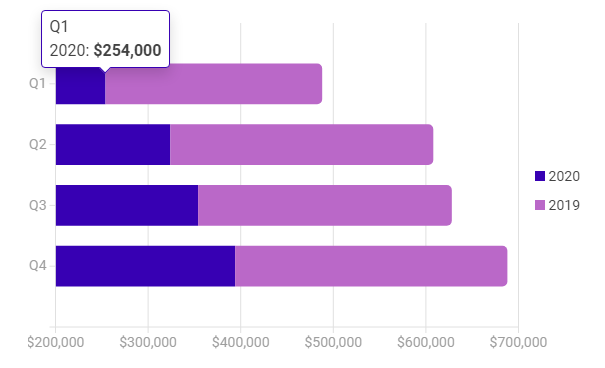
on example https://blazor.radzen.com/stacked-bar-chart we see normal bars, but when click run its not stacked. There is bug, must be RadzenStackedBarSeries component, not the RadzenBarSeries. Second bug its visualisation. When 2 bars stacked data display not correct like 254k$ < 234k$ by size of bar
Indeed the source code of the demo is wrong. We will fix that.
I can't reproduce the behavior you have pasted screenshots from though. Here is how it looks to me.


I just replace RadzenBarSeries to RadzenStackedBarSeries and click run
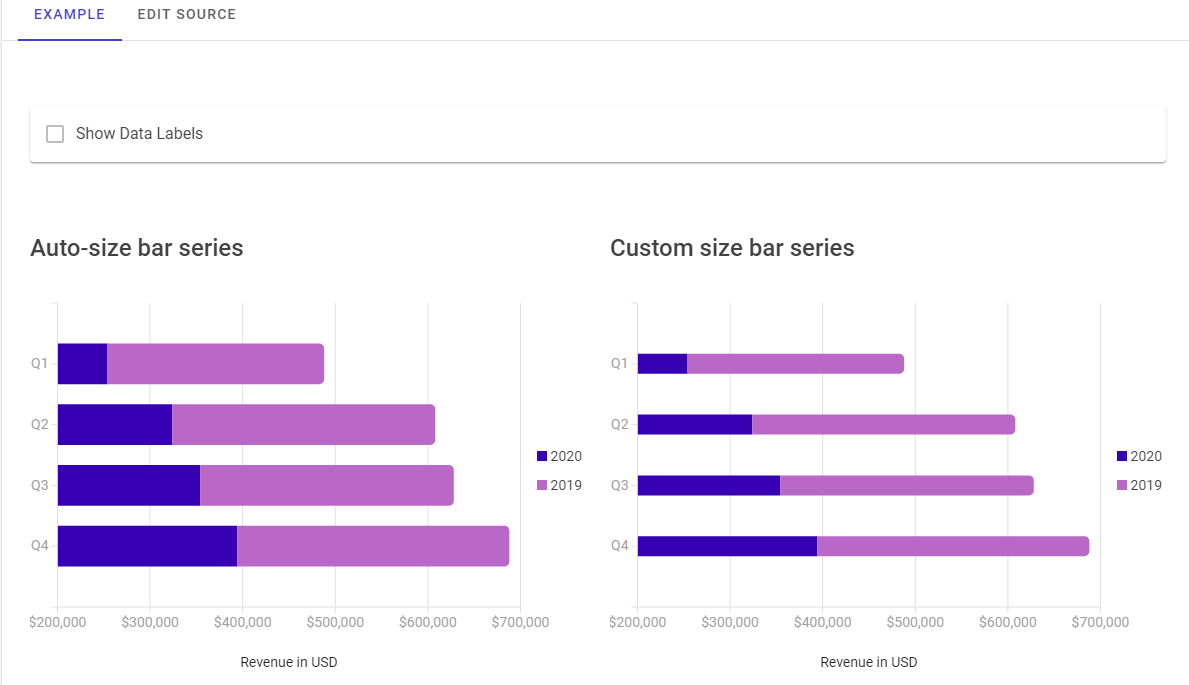
Its look after I click run, nothing changing else
Oh I see.
This happens because the min value of the value axis is 200000. If it is changed to 0 as in the online demo things would look as you expect it to.
<RadzenValueAxis Formatter="@FormatAsUSD" Min="0" Step="150000">

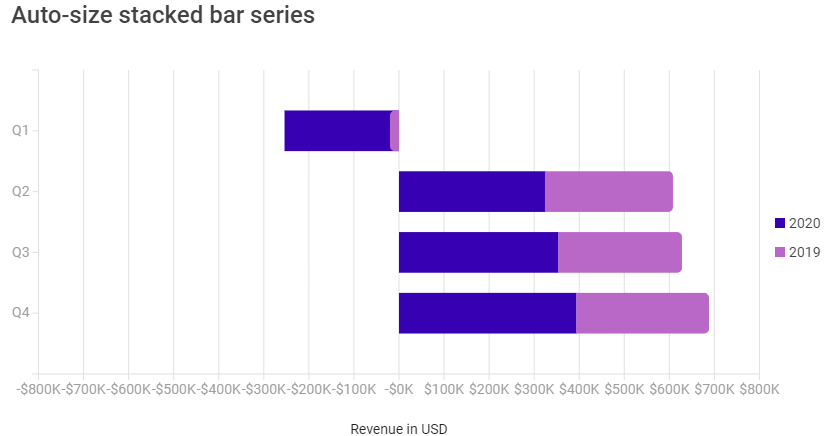
I found another problem for RadzenStackedBarSeries. At demo page(https://blazor.radzen.com/stacked-bar-chart),
change RadzenValueAxis.Min value to "-800000", and first "Revenue" value to -25400, you got incorrect visualization as following.