Stacked Area Chart doing some really weird things

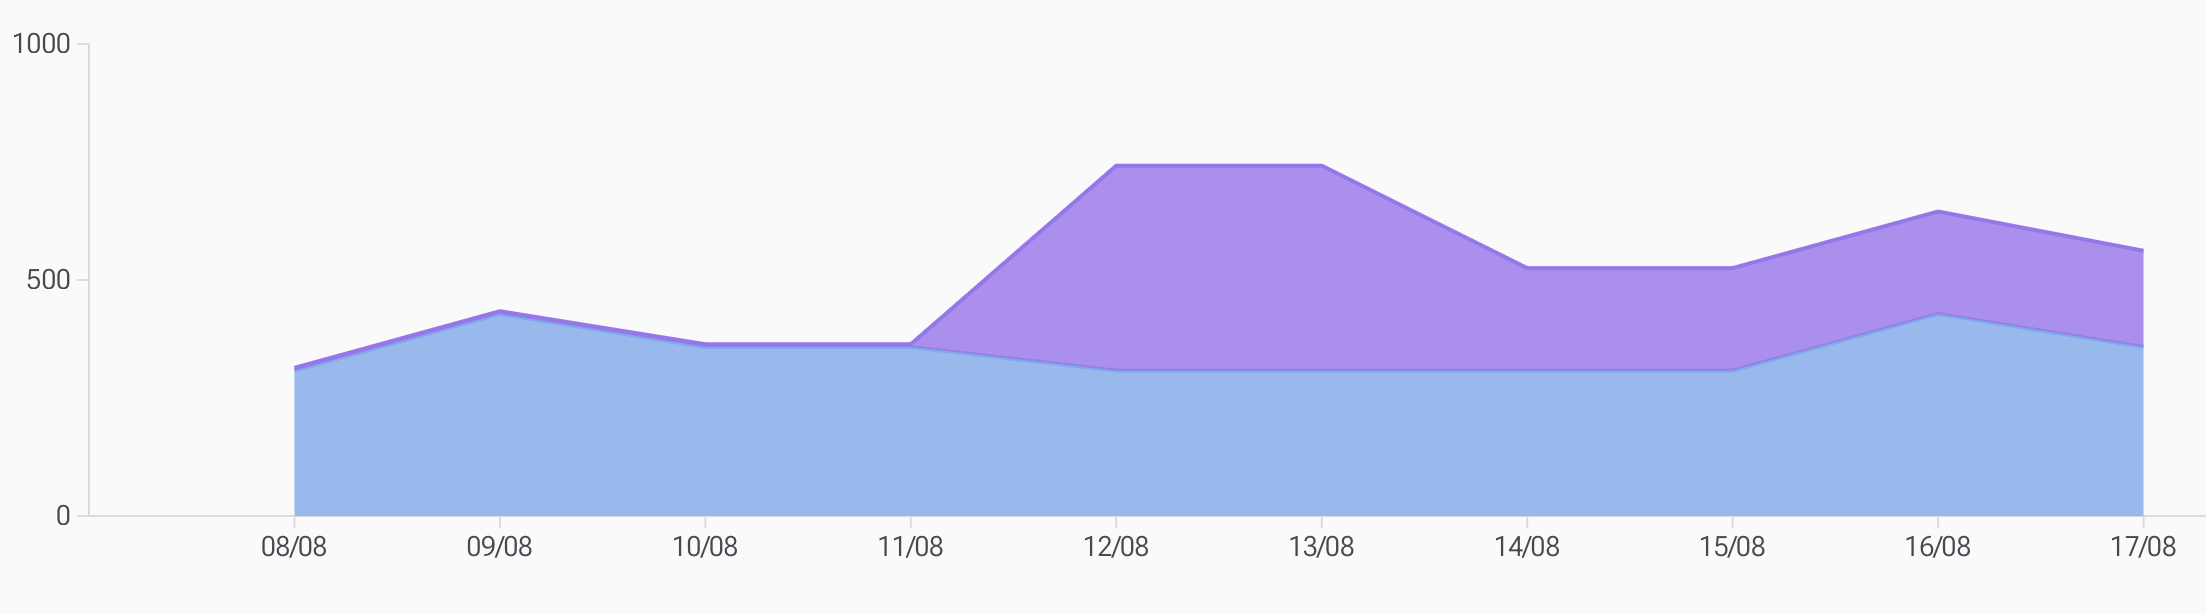
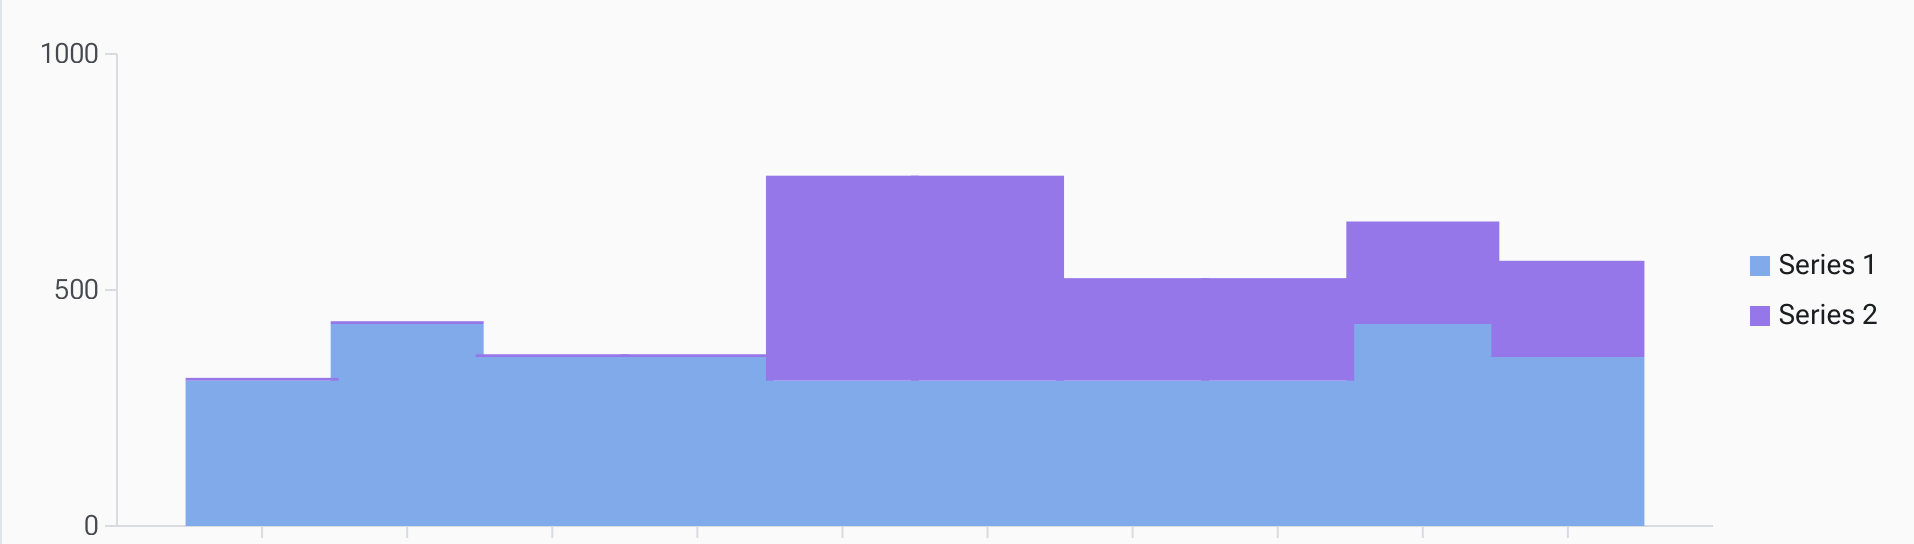
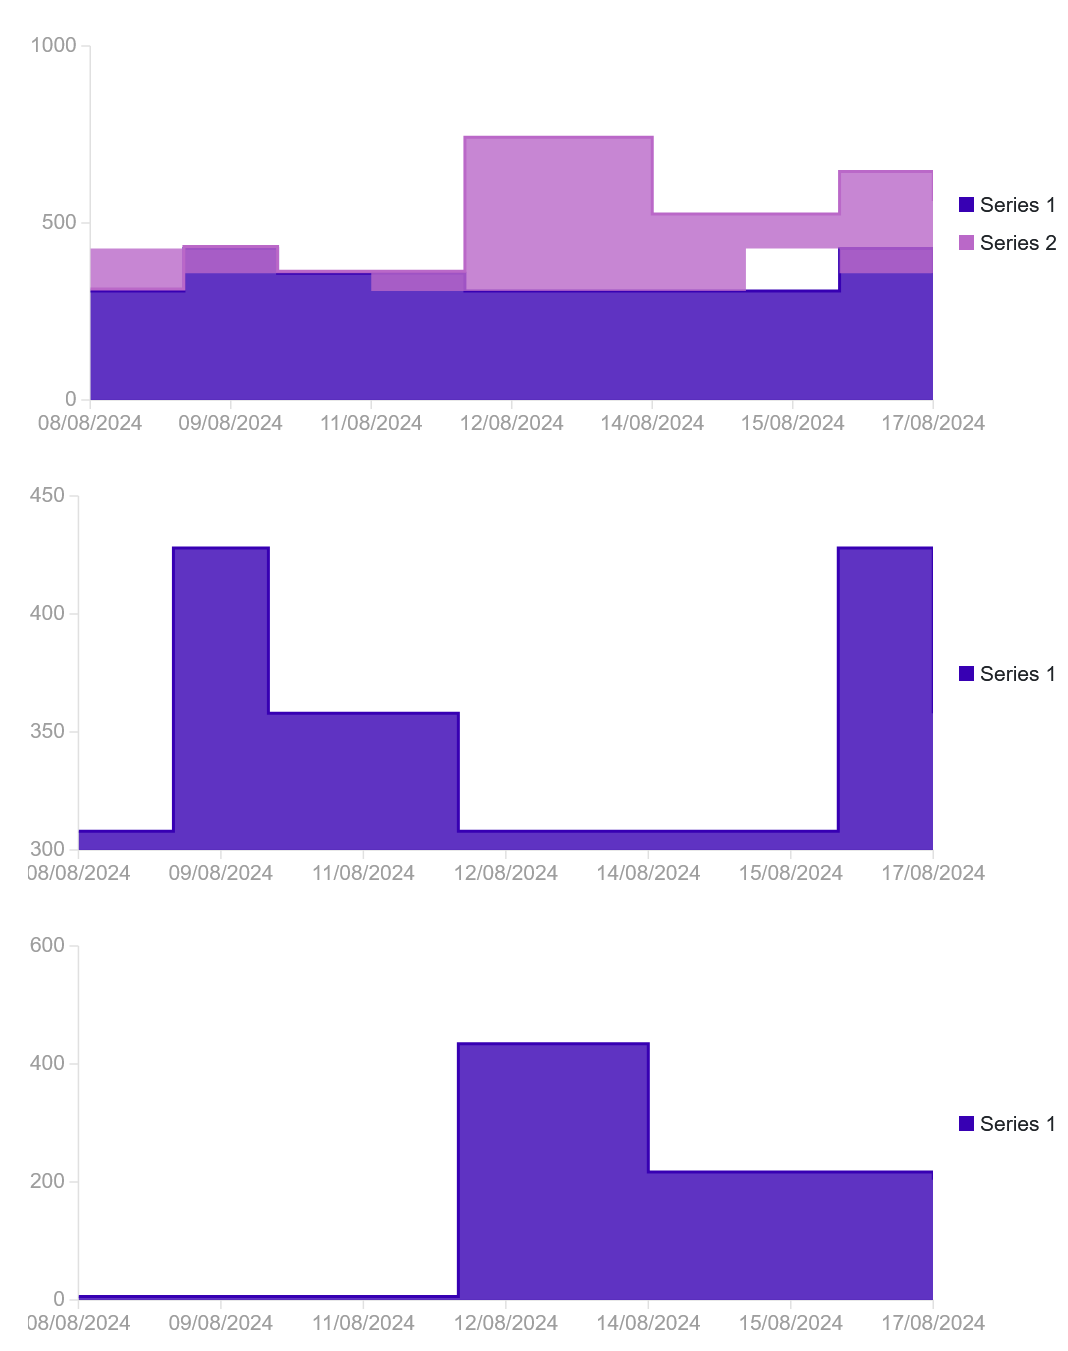
The chart at the top is what I'm seeing, with overlaps and random gaps. Below that are two charts using the same data separated into two series:

Here's the code:

@page "/"
@using System.Globalization
@using System.Text.Json

@if (GroupedAccounts != null)
{
    <RadzenChart>
        @foreach (var Account in GroupedAccounts)
        {
            <RadzenStackedAreaSeries Interpolation="Interpolation.Step" Data="@Account" CategoryProperty="Date" ValueProperty="Balance" TItem="DataModel" />
        }
    </RadzenChart>
    <RadzenChart>
        <RadzenStackedAreaSeries Interpolation="Interpolation.Step" Data="@Account1" CategoryProperty="Date" ValueProperty="Balance" TItem="DataModel" />
    </RadzenChart>
    <RadzenChart>
        <RadzenStackedAreaSeries Interpolation="Interpolation.Step" Data="@Account2" CategoryProperty="Date" ValueProperty="Balance" TItem="DataModel" />
    </RadzenChart>
}
@code {
    private List<List<DataModel>>? GroupedAccounts { get; set; }
    private List<DataModel>? Account1 { get; set; }
    private List<DataModel>? Account2 { get; set; }

    protected override void OnInitialized() => DeserializeJson();

    public void DeserializeJson()
    {
        string json = @"
        [
            [
                {
                  ""Date"": ""2024-08-08T00:00:00+01:00"",
                  ""Balance"": 307.98
                },
                {
                  ""Date"": ""2024-08-09T00:00:00+01:00"",
                  ""Balance"": 427.98
                },
                {
                  ""Date"": ""2024-08-10T00:00:00+01:00"",
                  ""Balance"": 357.98
                },
                {
                  ""Date"": ""2024-08-11T00:00:00+01:00"",
                  ""Balance"": 357.98
                },
                {
                  ""Date"": ""2024-08-12T00:00:00+01:00"",
                  ""Balance"": 307.98
                },
                {
                  ""Date"": ""2024-08-13T00:00:00+01:00"",
                  ""Balance"": 307.98
                },
                {
                  ""Date"": ""2024-08-14T00:00:00+01:00"",
                  ""Balance"": 307.98
                },
                {
                  ""Date"": ""2024-08-15T00:00:00+01:00"",
                  ""Balance"": 307.98
                },
                {
                  ""Date"": ""2024-08-16T00:00:00+01:00"",
                  ""Balance"": 427.98
                },
                {
                  ""Date"": ""2024-08-17T00:00:00+01:00"",
                  ""Balance"": 357.98
                }
            ],
            [
                {
                  ""Date"": ""2024-08-08T00:00:00+01:00"",
                  ""Balance"": 5.90
                },
                {
                  ""Date"": ""2024-08-09T00:00:00+01:00"",
                  ""Balance"": 5.90
                },
                {
                  ""Date"": ""2024-08-10T00:00:00+01:00"",
                  ""Balance"": 5.90
                },
                {
                  ""Date"": ""2024-08-11T00:00:00+01:00"",
                  ""Balance"": 5.90
                },
                {
                  ""Date"": ""2024-08-12T00:00:00+01:00"",
                  ""Balance"": 434.18
                },
                {
                  ""Date"": ""2024-08-13T00:00:00+01:00"",
                  ""Balance"": 434.18
                },
                {
                  ""Date"": ""2024-08-14T00:00:00+01:00"",
                  ""Balance"": 217.16
                },
                {
                  ""Date"": ""2024-08-15T00:00:00+01:00"",
                  ""Balance"": 217.16
                },
                {
                  ""Date"": ""2024-08-16T00:00:00+01:00"",
                  ""Balance"": 217.16
                },
                {
                  ""Date"": ""2024-08-17T00:00:00+01:00"",
                  ""Balance"": 203.91
                }
            ]
        ]";

        GroupedAccounts = JsonSerializer.Deserialize<List<List<DataModel>>>(json);
        if (GroupedAccounts != null)
        {
            Account1 = GroupedAccounts[0];
            Account2 = GroupedAccounts[1];
            StateHasChanged();
        }
    }

    public class DataModel
    {
        public required DateTime Date { get; set; }
        public decimal Balance { get; set; }
    }
}

What's happening here?

Try using a string for the category property instead of DateTime. RadzenChart interpolates DateTime categories which sometimes leads to unexpected results.

Thanks. I tried that and it made no difference at all:

@page "/"
@using System.Globalization
@using System.Text.Json

@if (GroupedAccounts != null)
{
    <RadzenChart>
        @foreach (var Account in GroupedAccounts)
        {
            <RadzenStackedAreaSeries Interpolation="Interpolation.Step" Data="@Account" CategoryProperty="DateString" ValueProperty="Balance" TItem="DataModel" />
        }
    </RadzenChart>
    <RadzenChart>
        <RadzenStackedAreaSeries Interpolation="Interpolation.Step" Data="@Account1" CategoryProperty="DateString" ValueProperty="Balance" TItem="DataModel" />
    </RadzenChart>
    <RadzenChart>
        <RadzenStackedAreaSeries Interpolation="Interpolation.Step" Data="@Account2" CategoryProperty="DateString" ValueProperty="Balance" TItem="DataModel" />
    </RadzenChart>
}
@code {
    private List<List<DataModel>>? GroupedAccounts { get; set; }
    private List<DataModel>? Account1 { get; set; }
    private List<DataModel>? Account2 { get; set; }

    protected override void OnInitialized() => DeserializeJson();

    public void DeserializeJson()
    {
        string json = @"
        [
            [
                    {
      ""DateString"": ""08/08"",
      ""Balance"": 307.98
    },
    {
      ""DateString"": ""09/08"",
      ""Balance"": 427.98
    },
    {
      ""DateString"": ""10/08"",
      ""Balance"": 357.98
    },
    {
      ""DateString"": ""11/08"",
      ""Balance"": 357.98
    },
    {
      ""DateString"": ""12/08"",
      ""Balance"": 307.98
    },
    {
      ""DateString"": ""13/08"",
      ""Balance"": 307.98
    },
    {
      ""DateString"": ""14/08"",
      ""Balance"": 307.98
    },
    {
      ""DateString"": ""15/08"",
      ""Balance"": 307.98
    },
    {
      ""DateString"": ""16/08"",
      ""Balance"": 427.98
    },
    {
      ""DateString"": ""17/08"",
      ""Balance"": 357.98
    }
            ],[
    {
      ""DateString"": ""08/08"",
      ""Balance"": 5.90
    },
    {
      ""DateString"": ""09/08"",
      ""Balance"": 5.90
    },
    {
      ""DateString"": ""10/08"",
      ""Balance"": 5.90
    },
    {
      ""DateString"": ""11/08"",
      ""Balance"": 5.90
    },
    {
      ""DateString"": ""12/08"",
      ""Balance"": 434.18
    },
    {
      ""DateString"": ""13/08"",
      ""Balance"": 434.18
    },
    {
      ""DateString"": ""14/08"",
      ""Balance"": 217.16
    },
    {
      ""DateString"": ""15/08"",
      ""Balance"": 217.16
    },
    {
      ""DateString"": ""16/08"",
      ""Balance"": 217.16
    },
    {
      ""DateString"": ""17/08"",
      ""Balance"": 203.91
    }
]
        ]";

        GroupedAccounts = JsonSerializer.Deserialize<List<List<DataModel>>>(json);
        if (GroupedAccounts != null)
        {
            Account1 = GroupedAccounts[0];
            Account2 = GroupedAccounts[1];
            StateHasChanged();
        }
    }

    public class DataModel
    {
        public required string DateString { get; set; }
        public decimal Balance { get; set; }
    }
}

The problem is Interpolation.Step. Here is how it looks without it:

I am not sure StackedAreaSeries could work with Step interpolation mode as it will cause both series to render quite differently and stacking won't happen.

The thing is,, when I started using this component (when it first came out) it worked as expected, and only started doing this a while ago.

I think the wider issue is one of symantics. What I need is to set stepping as a chart type setting, render style or something, but currently the interpolation setting is the only way to achieve that, even though stepping between actual values doesn't involve any interpolation. A step interpolation setting would only make sense if you wanted to step between intermediate divisions between data points, which I don't. What I need is more like a stacked bar chart with a gap of zero between the bars and no bar outlines, but this won't trace a line along the changing values.

In theory, it's a simple use-case but there doesn't seem to be a a way to do it.

You can try this:

    <RadzenChart>
        @foreach (var Account in GroupedAccounts)
        {
            <RadzenStackedColumnSeries  Data="@Account" CategoryProperty="DateString" ValueProperty="Balance" TItem="DataModel" />
        }
        <RadzenColumnOptions Margin="-10" />
    </RadzenChart>

Thanks. This solution definitely has its foibles - my page has an option to select the number of months shown on the graph and there's no one Margin setting that can cope with up to a 12X increase/decrease in datapoints without gaps or overlaps - but for now it's probably better than the area graph.