Good morning,
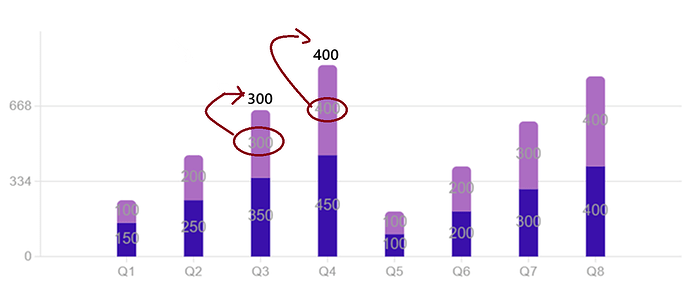
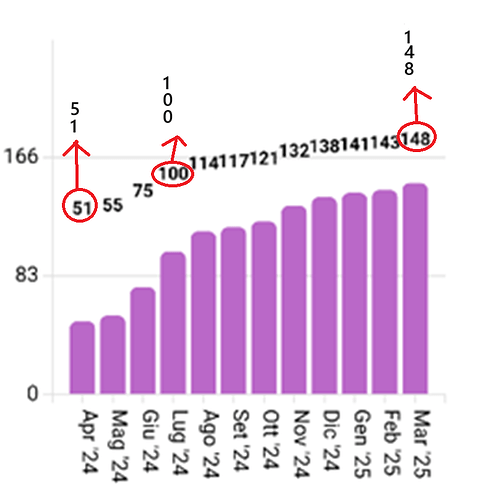
I'd like to know if is possible to move the values labels on the top of the bar as in the image and to change css of font-size (set small) and color of text (set black).
Tks very much and a good journey ![]()
Roberto
Hi @Roberto_Daniele,
The labels cannot be positioned at the top since this is a Stacked column chart with multiple data series. The labels however appear on top in single data series charts.
To change the apearance you can add the following styles:
<style>
    .rz-series-data-label {
        fill: black;
        font-size: 12px;
    }
</style>
Ok. Tks. And (more important for me for a better reading) is possible to rotate (90 degrees) the value on the top of each bar? (as in the image attached). I tried to insert "transform: 90deg" into css class but the displacement it's as if it concerned an area larger than the writing, ending up practically under everything.
Tks very much.
You can combine OffsetY="50" property to RadzenSeriesDataLabels with
CSS writing-mode and text-orientation.
<style>
    .rz-series-data-label {
        fill: black;
        font-size: 12px;
        writing-mode: vertical-rl;
        text-orientation: upright;
        letter-spacing: -2px;
    }
</style>
Ok I will try on Monday. Tks very much
Perfect. It's work! Tks very much again and a good journey ![]()

