Hi,
I am trying to use the new RadzenStackedColumnSeries, but we are experiencing a few display issues with it when using a DateTime category and the data for the different series contains gaps (for a particular category a series doesn't have a data point).
The issues we are experiencing are:
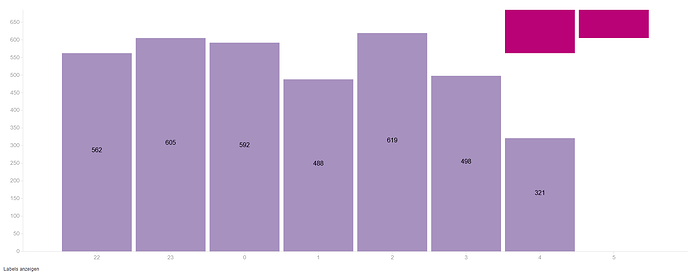
- The columns don't align with the axis. You can see in the screenshot that the bar for May 4th is actually on top of May 3rd, and not on top of May 4th. Some of the days are also duplicated on the category axis.
- The Radius in the RadzenColumnOptions isn't applied to the top of all bars. You can also see that in the screenshot, the blue bars don't have a Radius
- Sometimes the columns for the different data series don't sit on top of each other, it looks like the at the same height than the bars next to them.
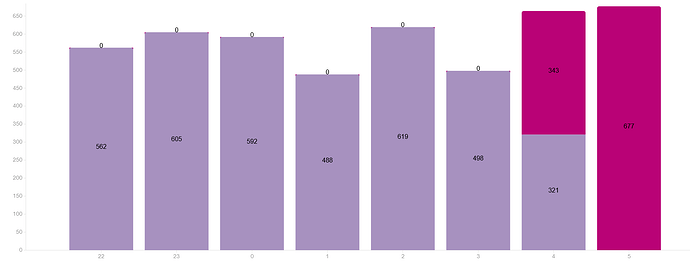
- When adding more days to the categories, the bars auto-resize a little bit, but it doesn't seem to be working very well. See the second screenshot. I have seen lots of posts in the forums mentioning auto resize issues, but we haven't been able to come up with a solution without hard-coding a certain column width. Is there a way we could handle a chart resize event so we could calculate the appropriate column width there? We went through the documentation but we couldn't find anything related to that.
For stacked columns that don't use a DateTime as the category and have data points for all the categories most of these issues don't seem to happen.
Second screenshot:
This is the code I am using in case it helps:
      <RadzenChart @ref="visitsChart">
        @foreach (var series in visitStats)
        {
          <RadzenStackedColumnSeries Data="@series.SeriesData" CategoryProperty="VisitDate" Title="@series.VisitorType" StrokeWidth="0" ValueProperty="VisitCount">
          </RadzenStackedColumnSeries>
        }
        <RadzenColumnOptions Radius="5" />
        <RadzenCategoryAxis Min="@(minDate)" Max="@(maxDate)" Padding="60" Formatter="@FormatDate">
          <RadzenAxisTitle Text="Visit Date" />
        </RadzenCategoryAxis>
        <RadzenValueAxis Min="0">
          <RadzenGridLines Visible="true" />
          <RadzenAxisTitle Text="Visits" />
        </RadzenValueAxis>
      </RadzenChart>
Thanks!


