thanks for the reply @korchev !
for anyone else who may stumble on this issue, i found a workaround. I call it a work around because although it is quite straightforward for this toy example of the Line Chart shown in the Radzen documentation, it is not so trivial in real world use-cases like the one i find myself in. Nonetheless, this solution should generalize to most if not all usecases
solution:
- map your category axis labels to a sequence of integers with a fixed step-size between each integer (the easiest would be 1, 2, 3, 4, 5, etc..). the reason for this is because RadzenChart seems to have the desired behavior when sorting numerical types.
- set the Step size to 1 on the RadzenCategoyAxis component to ensure all your category labels are shown and none are skipped.
- create a method that handles decoding the integer to your desired string by setting a delegate to the Formatter property of the RadzenCategoryAxis component.
For the default Line Chart Example, the encoding scheme is simple enough:
1 = "Jan", 2 = "Feb", 3 = "Mar", etc..
here is the full code of the default Line Chart example adapted with the solution described above:
@using System.Globalization

<RadzenStack class="rz-p-0 rz-p-md-6 rz-p-lg-12">
    <RadzenCard Variant="Variant.Outlined">
        <RadzenStack Orientation="Orientation.Horizontal" AlignItems="AlignItems.Center" Wrap="FlexWrap.Wrap">
            <RadzenStack Orientation="Orientation.Horizontal" AlignItems="AlignItems.Center" Gap="0.5rem">
                <RadzenCheckBox @bind-Value="@smooth" Name="smooth"></RadzenCheckBox>
                <RadzenLabel Text="Smooth" Component="smooth" />
            </RadzenStack>
            <RadzenStack Orientation="Orientation.Horizontal" AlignItems="AlignItems.Center" Gap="0.5rem">
                <RadzenCheckBox @bind-Value="@showDataLabels" Name="dataLabels"></RadzenCheckBox>
                <RadzenLabel Text="Show Data Labels" Component="dataLabels" />
            </RadzenStack>
            <RadzenStack Orientation="Orientation.Horizontal" AlignItems="AlignItems.Center" Gap="0.5rem">
                <RadzenCheckBox @bind-Value="@showMarkers" Name="markers"></RadzenCheckBox>
                <RadzenLabel Text="Show Markers" Component="markers" />
            </RadzenStack>
            <RadzenStack Orientation="Orientation.Horizontal" AlignItems="AlignItems.Center" Gap="0.5rem">
                <RadzenCheckBox @bind-Value="@sharedTooltip" Name="sharedToltip"></RadzenCheckBox>
                <RadzenLabel Text="Shared Tooltip" Component="sharedTooltip" />
            </RadzenStack>
        </RadzenStack>
    </RadzenCard>

   <RadzenChart>
        <RadzenChartTooltipOptions Shared="@sharedTooltip" />
        <RadzenLineSeries Smooth="@smooth" Data="@revenue2023" CategoryProperty="Date" Title="2023" LineType="LineType.Dashed" ValueProperty="Revenue">
            <RadzenMarkers Visible="@showMarkers" MarkerType="MarkerType.Square" />
            <RadzenSeriesDataLabels Visible="@showDataLabels" />
        </RadzenLineSeries>
        <RadzenLineSeries Smooth="@smooth" Data="@revenue2024" CategoryProperty="Date" Title="2024" ValueProperty="Revenue">
            <RadzenMarkers Visible="@showMarkers" MarkerType="MarkerType.Circle" />
            <RadzenSeriesDataLabels Visible="@showDataLabels" />
        </RadzenLineSeries>
        <RadzenCategoryAxis Padding="20" Step="1" Formatter="GetMonthAbbreviation"/>
        <RadzenValueAxis Formatter="@FormatAsUSD">
            <RadzenGridLines Visible="true" />
            <RadzenAxisTitle Text="Revenue in USD" />
        </RadzenValueAxis>
    </RadzenChart>
</RadzenStack>

@code {
    bool smooth = false;
    bool sharedTooltip = true;
    bool showDataLabels = false;
    bool showMarkers = true;

    public string GetMonthAbbreviation(object value)
{
    int month = Convert.ToInt32(value);
    // Validate the input.
    if (month < 1 || month > 12)
    {
        throw new ArgumentOutOfRangeException(nameof(month), "Month must be between 1 and 12.");
    }

    // Define an array where the index (0-based) corresponds to the month (1-based).
    string[] monthNames = new string[]
    {
        "Jan",  // 1
        "Feb",  // 2
        "Mar",  // 3
        "Apr",  // 4
        "May",  // 5
        "Jun",  // 6
        "Jul",  // 7
        "Aug",  // 8
        "Sept", // 9
        "Oct",  // 10
        "Nov",  // 11
        "Dec"   // 12
    };

    // Return the corresponding month abbreviation.
    return monthNames[month - 1];
}

    class DataItem
    {
        public int Date { get; set; }
        public double Revenue { get; set; }
    }

    string FormatAsUSD(object value)
    {
        return ((double)value).ToString("C0", CultureInfo.CreateSpecificCulture("en-US"));
    }

    DataItem[] revenue2023 = new DataItem[] {

        new DataItem
        {
            Date = 2,
            Revenue = 269000
        },
        new DataItem
        {
            Date = 3,
            Revenue = 233000
        },
        new DataItem
        {
            Date = 4,
            Revenue = 244000
        },
        new DataItem
        {
            Date = 5,
            Revenue = 214000
        },
        new DataItem
        {
            Date = 6,
            Revenue = 253000
        },
        new DataItem
        {
            Date = 7,
            Revenue = 274000
        },
        new DataItem
        {
            Date = 8,
            Revenue = 284000
        },
        new DataItem
        {
            Date = 9,
            Revenue = 273000
        },
        new DataItem
        {
            Date = 10,
            Revenue = 282000
        },
        new DataItem
        {
            Date = 11,
            Revenue = 289000
        },
        new DataItem
        {
            Date = 12,
            Revenue = 294000
        }
    };

    DataItem[] revenue2024 = new DataItem[] {
        new DataItem
        {
            Date = 1,
            Revenue = 334000
        },
        new DataItem
        {
            Date = 2,
            Revenue = 369000
        },
        new DataItem
        {
            Date = 3,
            Revenue = 333000
        },
        new DataItem
        {
            Date = 4,
            Revenue = 344000
        },
        new DataItem
        {
            Date = 5,
            Revenue = 314000
        },
        new DataItem
        {
            Date = 6,
            Revenue = 353000
        },
        new DataItem
        {
            Date = 7,
            Revenue = 374000
        },
        new DataItem
        {
            Date = 8,
            Revenue = 384000
        },
        new DataItem
        {
            Date = 9,
            Revenue = 373000
        },
        new DataItem
        {
            Date = 10,
            Revenue = 382000
        },
        new DataItem
        {
            Date = 11,
            Revenue = 389000
        },

    };
}
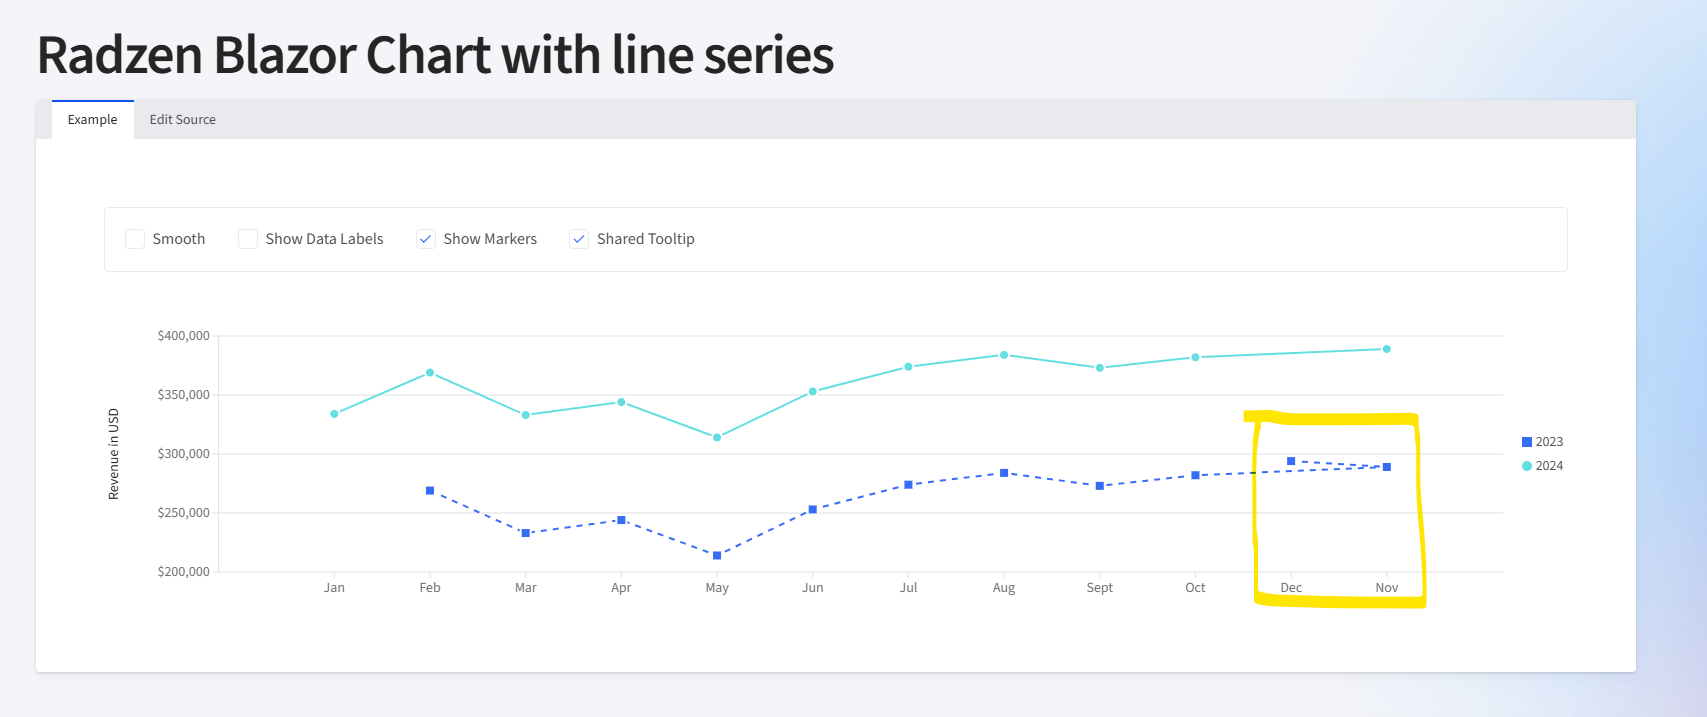
here is the chart rendered with both the missing gaps in data and the category labels correctly sorted: