Robot
January 23, 2024, 9:02am
1
Hi there,
In my project, I am trying to display currency symbols on the chart based on calling a function. The problem is I couldn't figure out how to use chart data to check the currency.
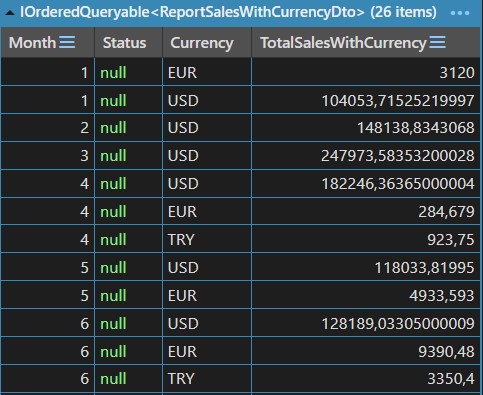
Here is my model:
public class ReportSalesWithCurrencyDto
{
    public int Month { get; set; }
    public string Status { get; set; }
    public string Currency { get; set; }
    public double? TotalSalesWithCurrency { get; set; }
}
Here is my chart:
<RadzenChart @ref="MonthlySalesWithCurrencyChart">
    <RadzenColumnSeries Data="@_monthlySalesWithCurrency" CategoryProperty="Month" Title="@year.ToString()" LineType="LineType.Dotted" ValueProperty="TotalSalesWithCurrency">
        <RadzenSeriesDataLabels Visible="@showDataLabels" />
    </RadzenColumnSeries>
    <RadzenColumnOptions Radius="5" Width="20" />
    <RadzenCategoryAxis Padding="1" />
    <RadzenValueAxis Formatter=@(sales => TryGetCurrencySymbol(sales.ToString(), out var symbol) ? $"{symbol}{sales}" : $"TRY {sales}")>
        <RadzenGridLines Visible="true" />
        <RadzenAxisTitle Text="Sales" />
    </RadzenValueAxis>
</RadzenChart>
The function I am calling to determine the currency symbol.
public static bool TryGetCurrencySymbol(string isoCurrencySymbol, out string symbol)
{
    symbol = CultureInfo
        .GetCultures(CultureTypes.AllCultures)
        .Where(c => !c.IsNeutralCulture)
        .Select(culture =>
        {
            try
            {
                return new RegionInfo(culture.Name);
            }
            catch
            {
                return null;
            }
        })
        .Where(ri => ri != null && ri.ISOCurrencySymbol == isoCurrencySymbol)
        .Select(ri => ri.CurrencySymbol)
        .FirstOrDefault();

    return symbol != null;
}
I want to pass the Currency property to this function but couldn't figure out how to. Any ideas on how to accomplish this?
The formatter receives only the value (in your case TotalSalesWithCurrency). To get the Currency property you can find the corresponding data item from _monthlySalesWithCurrency by the value:
string Formatter(object value)
{
  double totalSalesWithCurrency = (double) value;

var currency = _monthlySalesWithCurrency.
            FirstOrDefault(i => i. TotalSalesWithCurrency == totalSalesWithCurrency)
?.Currency;
}
Robot
January 23, 2024, 12:42pm
3
Thank you @korchev , now I can format the total sales.
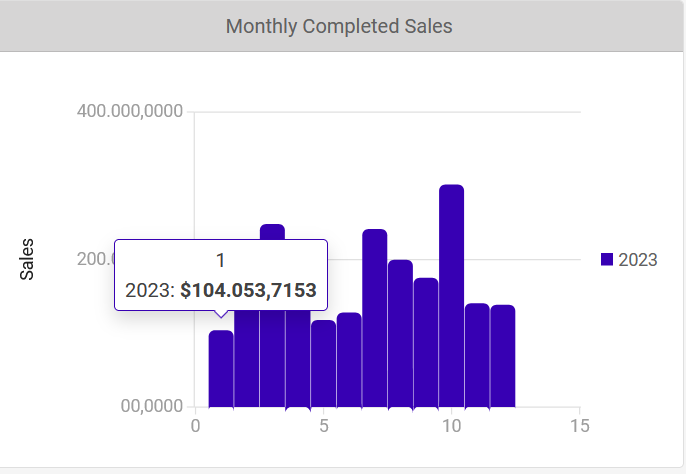
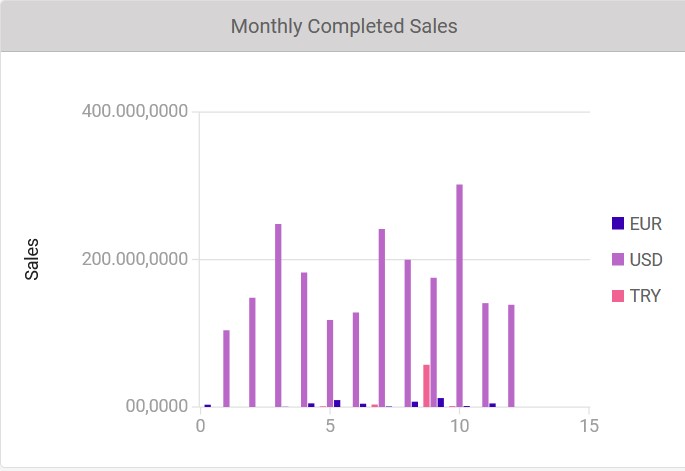
One more issue I would like to ask. I am grouping monthly sales by currency. Here are the values I am sending to the chart. As you can see from the picture, there should be both EUR and USD sales for the first month.
But I am only getting the USD on the chart. How can I display all of the total sales for the specific month?
<RadzenChart @ref="MonthlySalesWithCurrencyChart">
    <RadzenColumnSeries Data="@_monthlySalesWithCurrency" CategoryProperty="Month" Title="@year.ToString()" LineType="LineType.Dotted" ValueProperty="TotalSalesWithCurrency">
        <RadzenSeriesDataLabels Visible="@showDataLabels" />
    </RadzenColumnSeries>
    <RadzenColumnOptions Radius="5" Width="20" />
    <RadzenCategoryAxis Padding="1" />
    <RadzenValueAxis Formatter=@(sales => Formatter(sales))>
        <RadzenGridLines Visible="true" />
        <RadzenAxisTitle Text="Sales" />
    </RadzenValueAxis>
</RadzenChart>
public static string TryGetCurrencySymbol(string isoCurrencySymbol, out string symbol)
{
    symbol = CultureInfo
        .GetCultures(CultureTypes.AllCultures)
        .Where(c => !c.IsNeutralCulture)
        .Select(culture =>
        {
            try
            {
                return new RegionInfo(culture.Name);
            }
            catch
            {
                return null;
            }
        })
        .Where(ri => ri != null && ri.ISOCurrencySymbol == isoCurrencySymbol)
        .Select(ri => ri.CurrencySymbol)
        .FirstOrDefault();

    return symbol;
}

string Formatter(object value)
{
    var totalSalesWithCurrency = (double) value;

    var currency = _monthlySalesWithCurrency.
        FirstOrDefault(i => i.TotalSalesWithCurrency == totalSalesWithCurrency)
        ?.Currency;

    var currencySymbol = TryGetCurrencySymbol(currency, out var symbol);

    return $"{symbol}" + $"{totalSalesWithCurrency:0,#.0000}";
}
Robot
January 23, 2024, 12:52pm
4
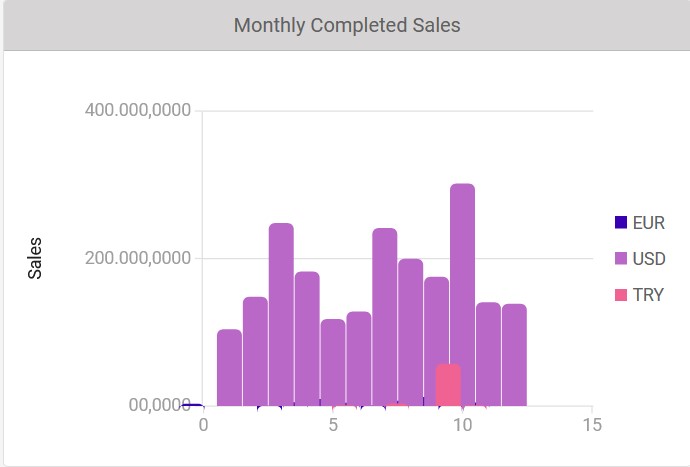
I tried like this but the series are overlapping. How can I fix it? Is there a way to display them side by side?
<RadzenChart @ref="MonthlySalesWithCurrencyChart">
    @foreach (var currency in _monthlySalesWithCurrency.Select(x => x.Currency).Distinct())
    {
        var salesDataForCurrency = _monthlySalesWithCurrency.Where(x => x.Currency == currency).ToList();
        <RadzenColumnSeries Data="@salesDataForCurrency" CategoryProperty="Month" Title="@currency" LineType="LineType.Dotted" ValueProperty="TotalSalesWithCurrency">
            <RadzenSeriesDataLabels Visible="@showDataLabels" />
        </RadzenColumnSeries>
    }
    <RadzenColumnOptions Radius="5" Width="20" />
    <RadzenCategoryAxis Padding="1" />
    <RadzenValueAxis Formatter=@(sales => Formatter(sales))>
        <RadzenGridLines Visible="true" />
        <RadzenAxisTitle Text="Sales" />
    </RadzenValueAxis>
</RadzenChart>
I think the width of the columns is too big for the total width of the chart. Try with smaller than 20 size.
Robot
January 23, 2024, 2:40pm
6
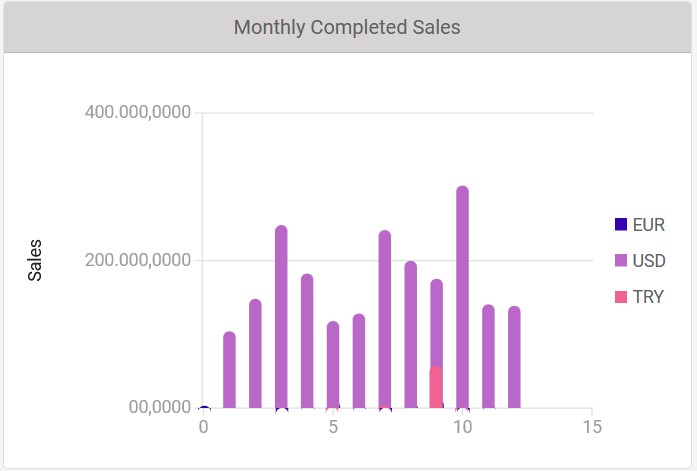
Tried with column width 10 but still having the same problem. Is there a way to display all of the data side by side in the chart?
Robot
January 23, 2024, 2:48pm
7
Width = 5 but it is barely visible. Any ideas on how to make the width bigger and display the series side by side?
No. You just can't fit all those series within the chart width. You either need to make the chart wider or display less data in it.
Robot
January 23, 2024, 3:02pm
9
How can I make the chart wider? Which CSS should I change?
korchev
January 23, 2024, 4:14pm
10
<RadzenChart style="width: 600px">