Hi !
I'm trying to achieve something like this with the RadzenChart component + annotations (last version) :
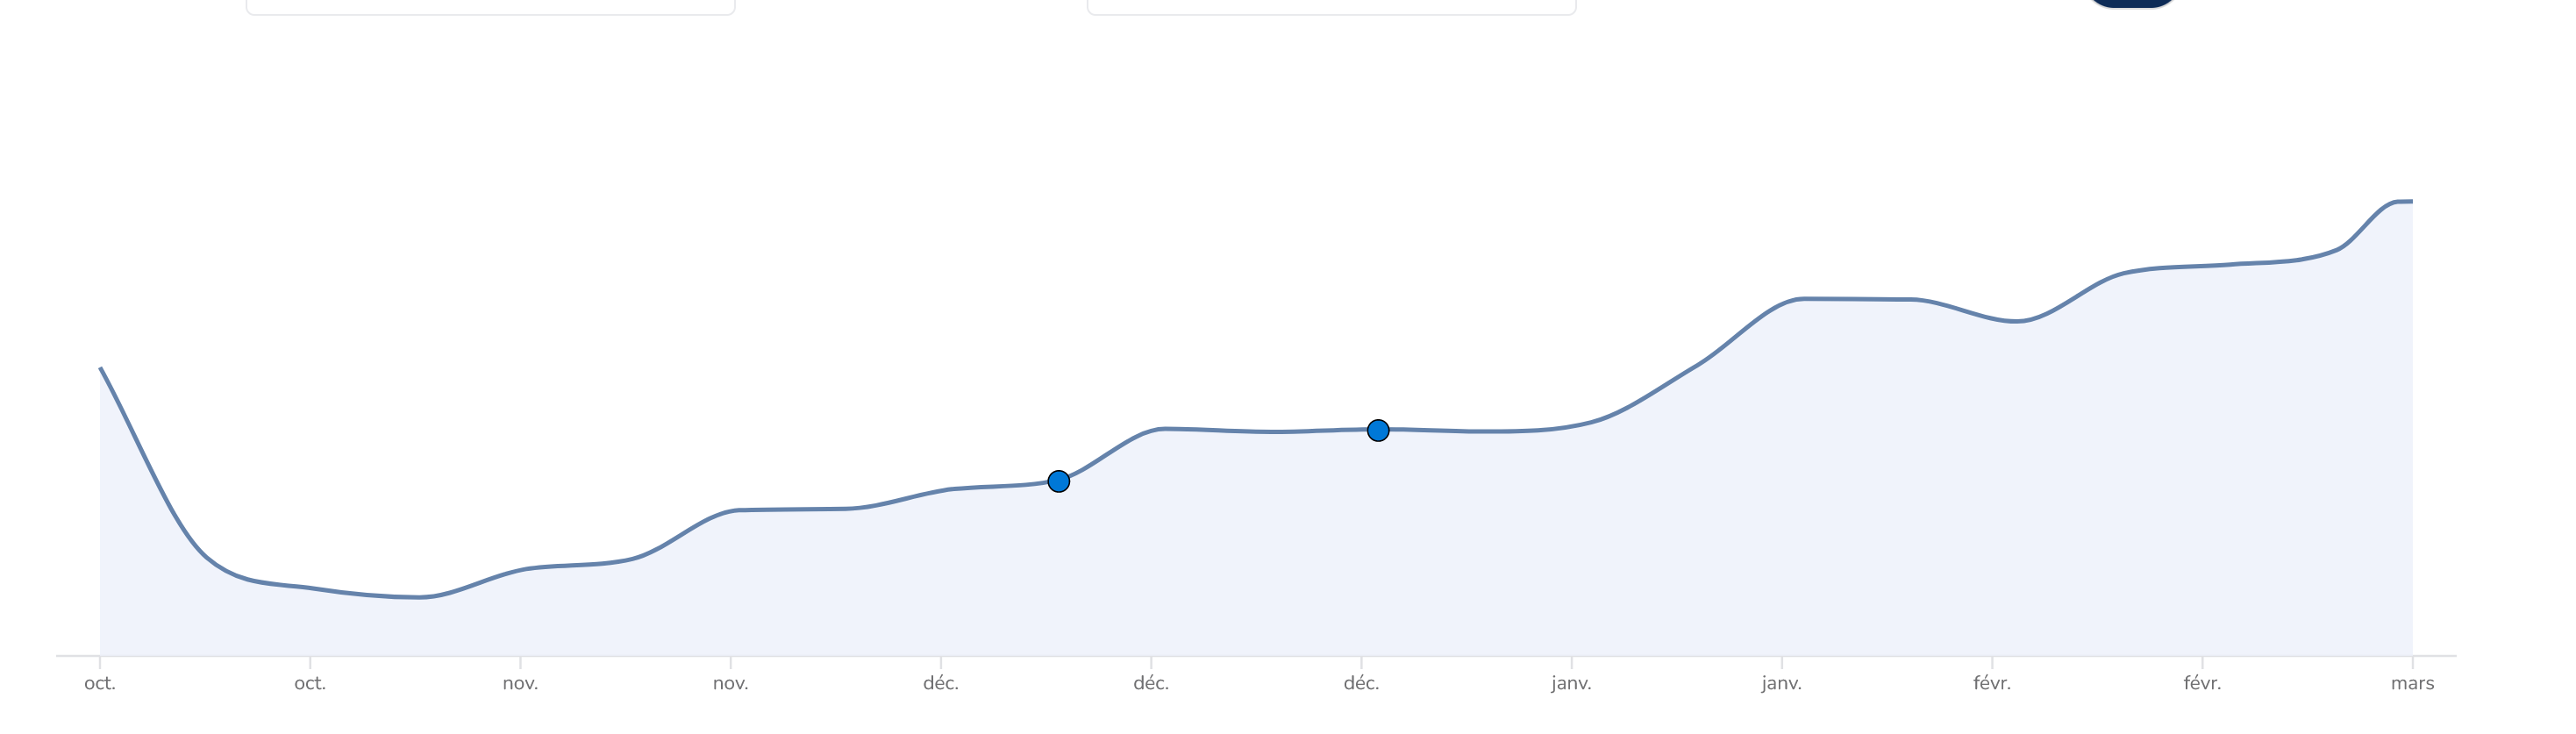
I have a Dictionary<DateTime, double>() binded to my RadzenAreaSeries.
The dictionary contains 1 point per week, let's say every Monday.
I need to display annotations on the line, but not only on Monday (can be every days of the weeks).
So far, the chart displays only the annotations on Mondays.
How can I achieve what I want using RadzenChart ?
Here is my code :
<RadzenChart>
  <RadzenAreaSeries Smooth="true" Data="@ChartData" CategoryProperty="Key" ValueProperty="Value" Fill="#edf1fa" Stroke="#6583ab">
      <TooltipTemplate Context="data">
          <div>
              <p class="is-size-7">@data.Key.ToString("dd MMM yyyy")</p>
              <p><b>@(data.Value.ToString("C2"))</b></p>
              @if (HistoryEvents.Any(x => x.DateFinPeriode == data.Key))
              {
                  var events = HistoryEvents.Where(x => x.DateFinPeriode == data.Key).ToList();

                  <br/>

                  foreach (var e in events)
                  {
                      <p class="is-size-7">@(e.LibelleAvecMontantBrut)</p>
                  }
              }
          </div>
      </TooltipTemplate>
      <ChildContent>
          @if (ChartData != null && ChartData.Any())
          {
              for (var i = 0; i < ChartData.Count; i++)
              {
                  var ii = i;
                  if (HistoryEvents.Any(x => x.DateFinPeriode == ChartData.ElementAt(ii).Key))
                  {
                      <RadzenSeriesAnnotation Visible=true TItem="KeyValuePair<DateTime, double>" Data="@ChartData.ElementAt(ii)" OffsetY="4" Text="🔵" />
                  }
              }
          }
      </ChildContent>
  </RadzenAreaSeries>
  <RadzenCategoryAxis Padding="20" Formatter="@FormatAsMonth" />
  <RadzenValueAxis Visible="false" />
  <RadzenLegend Visible="false" />
</RadzenChart>
Thank you !
EDIT :
- The same thing happens for the tooltips.
- I tried addind the missing dates with null values but couldn't make it work as it seems the component doesn't handle null values.