I'm using the RadzenStackedColumnSeries, dynamically created in a foreach loop inside a RadzenChart.
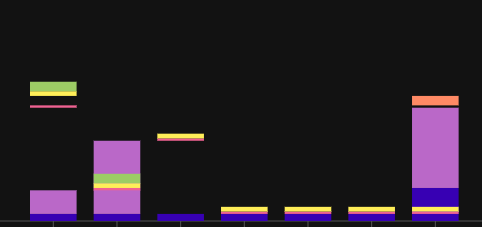
The columns values seem to float in some cases, with gaps in the columns.
Could anyone help me understand what I'd need to do to fix this?
I'm using the RadzenStackedColumnSeries, dynamically created in a foreach loop inside a RadzenChart.
The columns values seem to float in some cases, with gaps in the columns.
Could anyone help me understand what I'd need to do to fix this?
Hi @DB1234,
Unfortunately we haven't seen this behavior before. Could you provide some reproduction? We need the data used to populate the chart as well as its configuration.
Circling back to this as I'm seeing it on another stacked column chart. Is there an email I can share code to troubleshoot without posting publicly?
Hi @DB1234,
You can send us more details to info@radzen.com. It could be easier to change the configuration in our online demo until it shows the same erroneous behavior. You can edit the demo by clicking the Edit source tab.