Hello,
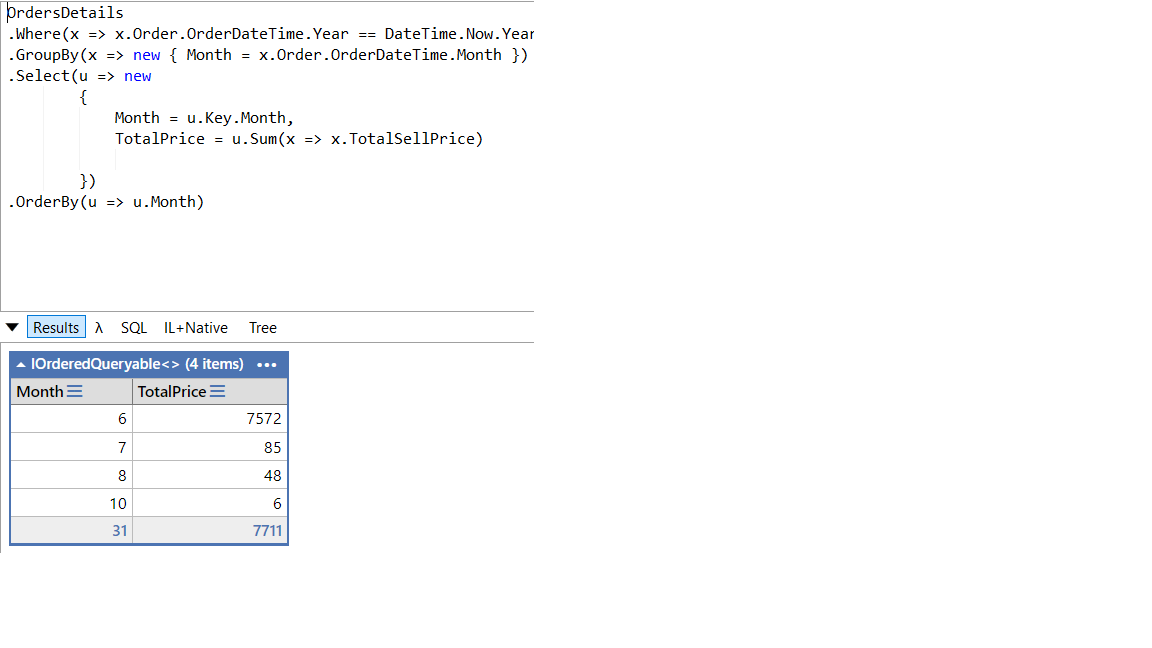
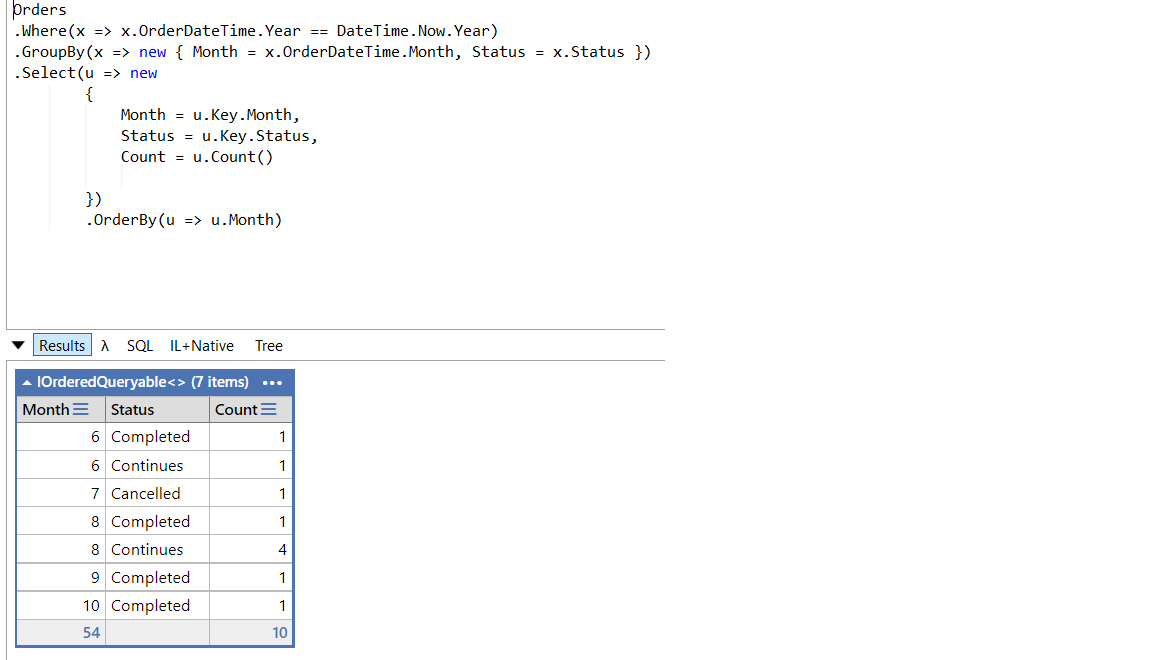
I am using Radzen chart. My query returns more than one result, as seen in the screenshot. How can i show these results from this query in this chart? Honestly, I don't fully understand the logic. I am requesting your support.
<RadzenChart>
                    <RadzenColumnSeries Data="@yearlyStatus" CategoryProperty="Status" Title="2022" LineType="LineType.Dashed" ValueProperty="Count" >
                        <RadzenSeriesDataLabels Visible="@showDataLabels" />
                    </RadzenColumnSeries>
                    <RadzenColumnOptions Radius="10" />
                    <RadzenValueAxis Formatter="@FormatAsUSD">
                        <RadzenGridLines Visible="true" />
                        <RadzenAxisTitle Text="Amount" />
                    </RadzenValueAxis>
                </RadzenChart>
@code {
    bool showDataLabels = true;
    private static int currentYear = DateTime.Today.Year;
    private ICollection<string> colors = new List<string>() { "#FBC687", "#F4F7C5", "#93ABD3" };
    private ICollection<AnnualStatusViewModel> yearlyStatus;

    protected override async Task OnInitializedAsync()
    {
        yearlyStatus = await AnnualStatusViewModel.ExecuteAsync();

        StateHasChanged();
    }


}