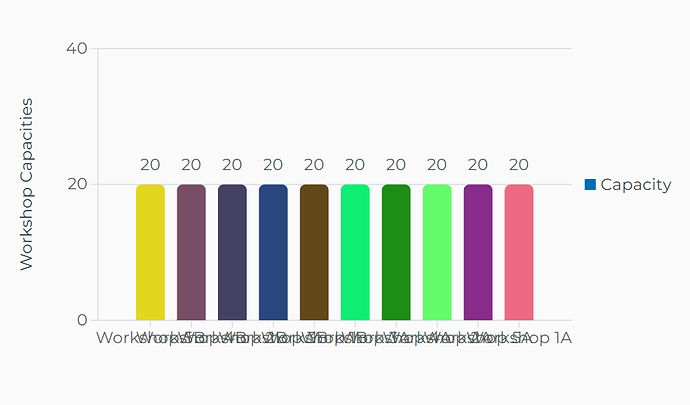
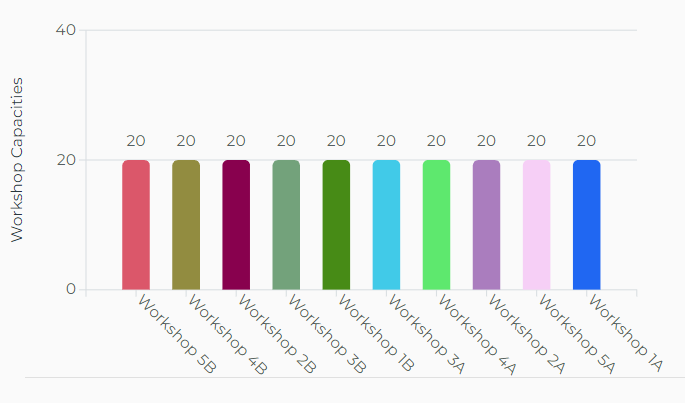
I've integrated the Radzen chart to display the capacity of event workshops. Currently, the labels on the bars are overlapping, which makes the chart hard to read. I'd prefer to display the bar labels in the chart legend, with their corresponding colors, to make it more user-friendly. Below is the code I've used. Could you help me refine it to meet my requirements?
Here's the chart for displaying event workshop capacity:
<RadzenCustomBarChart WorkshopData="@workshopData" />
@code {
    private ChartItem[] workshopData { get; set; }

    protected override async Task OnInitializedAsync()
    {
        await GetEvent();
    }

    private async Task GetEvent()
    {
        // Code to fetch the event object

        workshopData = new ChartItem[1];
        var workshopSessions = myEvent.Sessions.Where(x => x.SessionType == SessionTypeEnum.WORKSHOP).ToList();
        workshopData = workshopSessions.Select(ws => new ChartItem
        {
            Label = ws.Code,
            Value = ws.Capacity
        }).ToArray();
    }
}
This is the RadzenCustomBarChart component:
<RadzenChart>
    <RadzenColumnSeries Data="@WorkshopData"
                        CategoryProperty="Label"
                        Title="Capacity"
                        Fills="@GetColors(WorkshopData.Length)"
                        LineType="LineType.Dashed"
                        ValueProperty="Value">
        <RadzenSeriesDataLabels Visible="true"/>
    </RadzenColumnSeries>
    <RadzenColumnOptions Radius="5" Width="25" />
    <RadzenCategoryAxis Padding="10" />
    <RadzenValueAxis>
        <RadzenGridLines Visible="true"/>
        <RadzenAxisTitle Text="Workshop Capacities"/>
    </RadzenValueAxis>
</RadzenChart>
@code {
    [Parameter]
    public ChartItem[] WorkshopData { get; set; }

    private string[] GetColors(int count)
    {
        string[] colors = new string[count];
        Random random = new Random();
        for (int i = 0; i < count; i++)
        {
            colors[i] = $"#{random.Next(0x1000000):X6}";
        }
        return colors;
    }
}
And the ChartItem class definition:
public class ChartItem
{
    public string Label { get; set; }
    public double Value { get; set; }
}

