Hi,
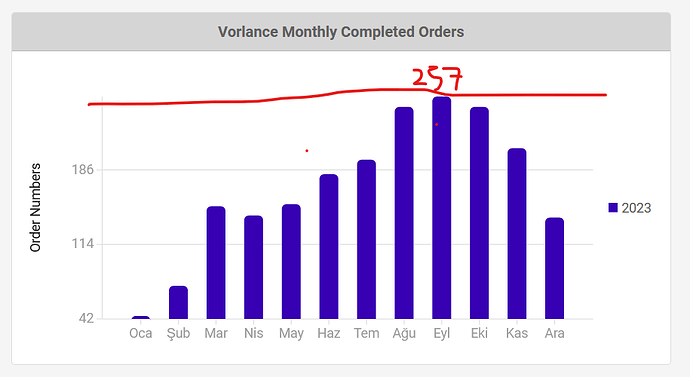
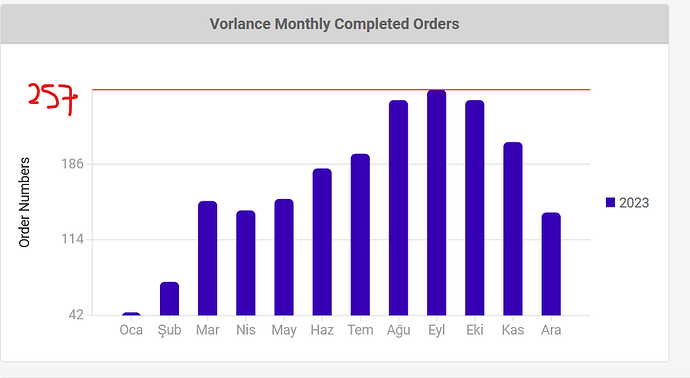
I am displaying the maximum number of orders (257) like this sample screenshot with a red line. Is there a way to put the line to the max in the chart?
<div class="col-lg-6 px-2 py-2 my-0 text-center" hidden="@IsHidden">
    <div class="d-grid gap-2 d-sm-flex justify-content-sm-center">
        <div class="col-lg-12">
            <div class="card">
                <div class="card-header" style="background-color: #d6d5d5">
                    <strong>Vorlance Monthly @value Orders</strong>
                </div>
                <div class="card-body">
                    <RadzenChart @ref="MonthlyChart">
                        <RadzenColumnSeries Data="@chartDataMonthlyOrders" CategoryProperty="Month" Title="@year.ToString()" LineType="LineType.Dotted" ValueProperty="Count">
                            <RadzenSeriesDataLabels Visible="@showDataLabels"/>
                        </RadzenColumnSeries>
                        <RadzenColumnOptions Radius="5" Width="20"/>
                        <RadzenCategoryAxis Padding="1" />
                        <RadzenValueAxis Min="@minMonthlyOrders" Max="@maxMonthlyOrders">
                            <RadzenGridLines Visible="true"/>
                            <RadzenAxisTitle Text="Order Numbers"/>
                        </RadzenValueAxis>
                    </RadzenChart>
                </div>
            </div>
        </div>
    </div>
</div>

