Is it possible to have more than one RadzenValueAxis? I have data that uses a common X axis (time) but their values are measured differently. One value, for example, is measured in temperature while the other value is measured in pressure.
Hi guys, please implement multiple value axes as Teletik does. Your charts are much better then Telerik allowing to display bars and line in the normal orientation. We could by a licence from you under condition that you have multiple value axes in charts. From June 2020 you did nothing, may be it is time to finished the job on charts.
Multiple value axes aren't supported. We will probably implement that at some point but it is definitely not something we are currently working on or planning to work on soon.
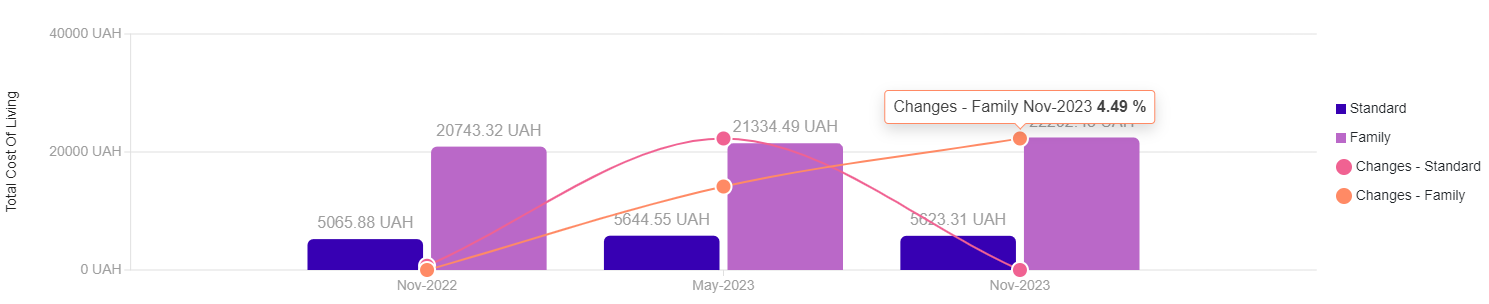
Not sure if anyone is still interested but, in my case, I solved this issue by manually linearly scaling the values for different line series that are placed upon the bar series and it work as intended, without the actual secondary axis of course but with the help of the tooltip it is usable.