Hi,
I added a RadzenChart with ColumnSeries in my Blazor Server-Side project. I added a RadzenValueAxis element to specify Min=0, Step = 500, Max=4000, my values all being in a 1800-2900 range.
It works perfectly fine the first time it loads, the Y axis starts at 0 and the maximum is at 4000.
Is there a way to make the Min and Max values stick when switching tabs?
Thank you
                <RadzenChart>
                <RadzenColumnSeries Data="@data" CategoryProperty="QuarterLabel" Title="Budget" LineType="LineType.Dashed" ValueProperty="prop1">
                        <RadzenSeriesDataLabels Visible="false" />
                    </RadzenColumnSeries>
                <RadzenColumnSeries Data="@data" CategoryProperty="QuarterLabel" Title="E1" LineType="LineType.Dashed" ValueProperty="prop2">
                        <RadzenSeriesDataLabels Visible="false" />
                    </RadzenColumnSeries>
                <RadzenColumnOptions Radius="5" Width="20" />
                    <RadzenCategoryAxis Padding="20" />
                <RadzenValueAxis Formatter="@FormatAsKEUR">
                        <RadzenGridLines Visible="true" />
                        <RadzenAxisTitle Text="Budget in kEUR" />
                    **<RadzenValueAxis Min="0" Step="500" Max="6000" />**
                    </RadzenValueAxis>
                </RadzenChart>
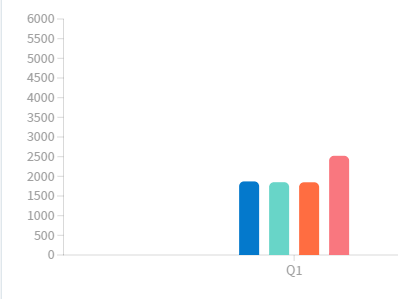
Result of the first load (I used a max of 6000 in that test, to make it obvious)
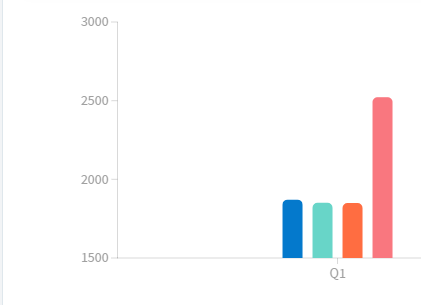
Result of second load, after switching tabs
korchev
September 13, 2022, 6:07am
2
Hi @damien7792 ,
I updated our online demo to this
<RadzenTabs>
    <Tabs>
        <RadzenTabsItem Text="Other tab">
            Other tab
        </RadzenTabsItem>
        <RadzenTabsItem Text="Chart tab">
            <RadzenCard Class="w-100 mb-4">
                <RadzenCheckBox @bind-Value="@showDataLabels" Name="dataLabels"></RadzenCheckBox>
                <RadzenLabel Text="Show Data Labels" For="dataLabels"
                    Style="margin-left: 8px; vertical-align: middle;" />
            </RadzenCard>
            <RadzenChart>
                <RadzenColumnSeries Data="@revenue2020" CategoryProperty="Quarter" Title="2020"
                    LineType="LineType.Dashed" ValueProperty="Revenue">
                    <RadzenSeriesDataLabels Visible="@showDataLabels" />
                </RadzenColumnSeries>
                <RadzenColumnSeries Data="@revenue2019" CategoryProperty="Quarter" Title="2019" ValueProperty="Revenue">
                    <RadzenSeriesDataLabels Visible="@showDataLabels" />
                </RadzenColumnSeries>
                <RadzenColumnOptions Radius="5" />
                <RadzenValueAxis Formatter="@FormatAsUSD" Step="500000" Min="0" Max="2000000">
                    <RadzenGridLines Visible="true" />
                    <RadzenAxisTitle Text="Revenue in USD" />
                </RadzenValueAxis>
            </RadzenChart>
        </RadzenTabsItem>
    </Tabs>
</RadzenTabs>
This seems to work as expected though - the Min and Max values are taken under consideration after switching tabs.
Can you provide a minimal reproduction of the issue so we can troubleshoot further?
Thank you for your answer.
@page "/testphasing"
@using Classes;

<h3>TestGraphMinValue</h3>

<RadzenTabs TabPosition="TabPosition.Top" RenderMode="TabRenderMode.Client">
    <Tabs>

        <RadzenTabsItem Text="By Quarter">


                <RadzenChart>
                <RadzenColumnSeries Data="@quarterData" CategoryProperty="Label" Title="ValueA" LineType="LineType.Dashed" ValueProperty="ValueA">
                        <RadzenSeriesDataLabels Visible="false" />
                    </RadzenColumnSeries>
                <RadzenColumnSeries Data="@quarterData" CategoryProperty="Label" Title="ValueB" LineType="LineType.Dashed" ValueProperty="ValueB">
                        <RadzenSeriesDataLabels Visible="false" />
                    </RadzenColumnSeries>
                <RadzenColumnOptions Radius="5" Width="20" />
                    <RadzenCategoryAxis Padding="20" />
                <RadzenValueAxis>
                        <RadzenGridLines Visible="true" />
                        <RadzenAxisTitle Text="Budget in kEUR" />
                    <RadzenValueAxis Min="0" Step="500" Max="4000" />
                    </RadzenValueAxis>
                </RadzenChart>

        </RadzenTabsItem>

        <RadzenTabsItem Text="By Month">


            <RadzenChart>
                <RadzenColumnSeries Data="@monthData" CategoryProperty="Label" Title="ValueA" LineType="LineType.Dashed" ValueProperty="ValueA">
                    <RadzenSeriesDataLabels Visible="false" />
                </RadzenColumnSeries>
                <RadzenColumnSeries Data="@monthData" CategoryProperty="Label" Title="ValueB" LineType="LineType.Dashed" ValueProperty="ValueB">
                    <RadzenSeriesDataLabels Visible="false" />
                </RadzenColumnSeries>
                <RadzenColumnOptions Radius="5" Width="20" />
                <RadzenCategoryAxis Padding="20" />
                <RadzenValueAxis>
                    <RadzenGridLines Visible="true" />
                    <RadzenAxisTitle Text="Budget in kEUR" />
                    <RadzenValueAxis Min="0" Step="500" Max="4000" />
                </RadzenValueAxis>
            </RadzenChart>


        </RadzenTabsItem>
    </Tabs>
</RadzenTabs>

@code {
    private List<DataPoint> quarterData = new();
    private List<DataPoint> monthData = new();

    protected override async Task OnParametersSetAsync()
    {
        LoadData();
    }

    private void LoadData()
    {
        quarterData = new List<DataPoint>() { new DataPoint() { Label = "Q1", ValueA = 1850.50, ValueB = 2100.80 }, new DataPoint() { Label = "Q2", ValueA = 1985.74, ValueB = 2250.25 } };
        monthData = new List<DataPoint>() { new DataPoint() { Label = "Jan", ValueA = 615.50, ValueB = 740.80 }, new DataPoint() { Label = "Feb", ValueA = 630.74, ValueB = 750.25 } };
    }
}
korchev
September 13, 2022, 3:14pm
4
This looks invalid - there is a nested RadzenValueAxis tag which isn't supported.
Try this:
                <RadzenValueAxis Min="0" Step="500" Max="4000">
                    <RadzenGridLines Visible="true" />
                    <RadzenAxisTitle Text="Budget in kEUR" />
                </RadzenValueAxis>
Ouch, sorry about that! That was the issue :-/