Hello everyone.
I am currently using radzen blazor components to display usage statistics for a software. We want to display a line each for the users of one customer and compare it to the amout of users of all customers in total. This is what the graph should look like.

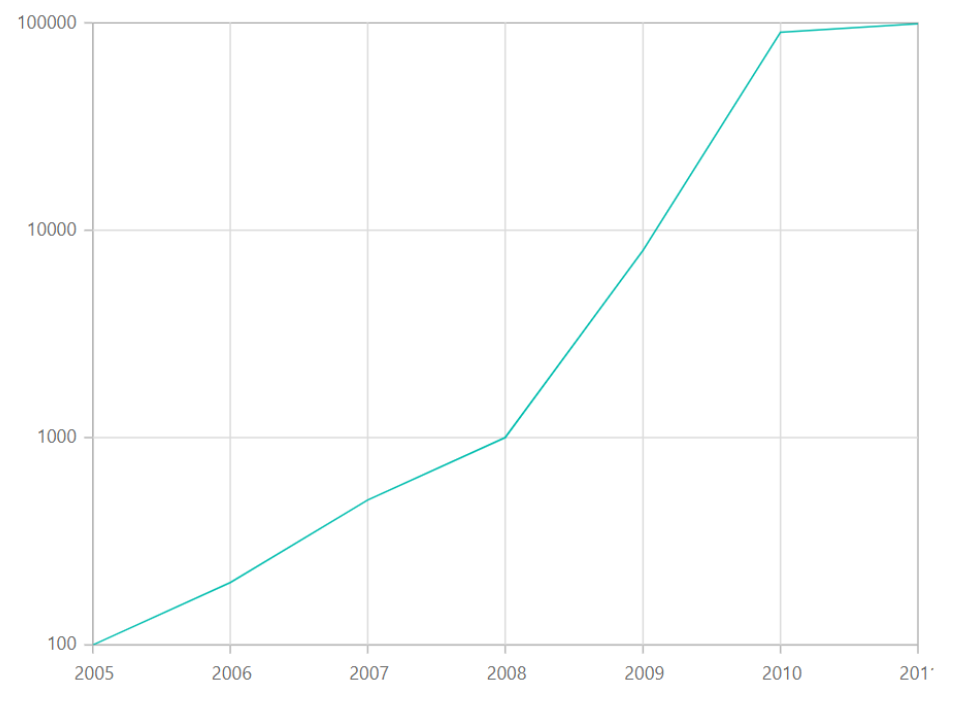
However, the orange and dark blue lines might be a lot lower than the light blue line and appear to be at 0. So we thought about displaying the "usages" axis logarithmically to shorten the distance between the lines. So instead of +20000 for each step we want something like *100 per step. Similar to this:
Unfortunately i could not find how to do this with Radzen. The step property seems to just add a fixed amount for each step instead of multiplying the last step my a specific factor. Other frameworks do this by setting some sort of ValueType or automatic calculation setting for the axis. I could not find anything like this on the Radzen charts.
Is there another way of doing this or am i missing something?