LineChart "Step must be a number"

Hi,
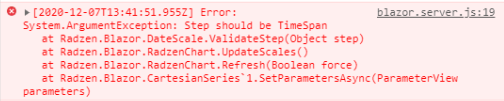
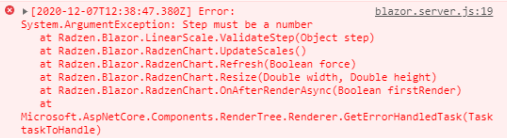
I'm getting an exception "Step must be a number" when opening a line chart page with Step defined for RadzenCategoryAxis.

image

My .razor is as follows:

<RadzenChart Style="width: 100%; height: 600px;">
				@foreach (var graph in graphs)
				{
					<RadzenLineSeries Smooth="@graph.Smooth" Data="@graph.Values" CategoryProperty="Timestamp" ValueProperty="ScaledValue" Title="@graph.Tag" Stroke="@graph.Color"
									  StrokeWidth="@graph.Width" LineType="@graph.Style">
						<TooltipTemplate Context="data">
							<div class="row">
								<div class="col-6"><strong>@data.Graph.Tag</strong></div>
								<div class="col-6 text-right"><strong>@data.Value.ToString("F3")</strong></div>
							</div>
							<div class="row">
								<div class="col"><i>@data.Timestamp.ToString("yyyy-MM-dd HH:mm:ss.fff")</i></div>
							</div>
						</TooltipTemplate>
					</RadzenLineSeries>
				}
				<RadzenCategoryAxis Stroke="#ffffff80" FormatString="{0:yyyy-MM-dd HH:mm:ss.fff}" Step="@GraphStepTime">
					<RadzenTicks Stroke="#ffffff80" StrokeWidth="2" />
					<RadzenGridLines Visible="true" />
				</RadzenCategoryAxis>
				<RadzenValueAxis Formatter="@FormatAsZeroDecimal" Stroke="#ffffff80" Min="@GraphMinY" Max="@GraphMaxY" Step="@GraphStepY">
					<RadzenGridLines Visible="true" />
					@*<RadzenAxisTitle Text="" />*@
					<RadzenTicks Stroke="#ffffff80" StrokeWidth="2" />
				</RadzenValueAxis>
				<RadzenLegend Visible="true" Position="LegendPosition.Bottom" />
				<RadzenTooltipOptions Visible="true"></RadzenTooltipOptions>
			</RadzenChart>

It does not matter whatever value I specify for the GraphStepTime variable (which is a TimeSpan), the exception still occurs. This happens in the latest version v2.18.3 as well.

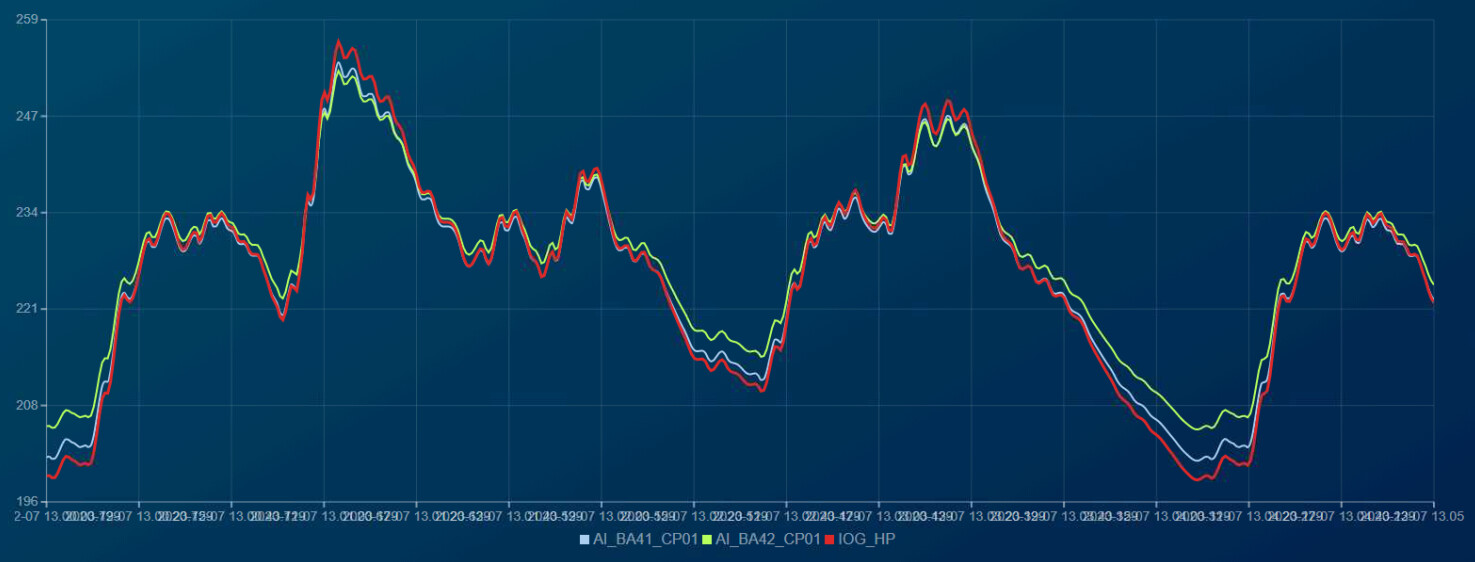
All the other bindings work fine, and I'm able to use the line chart when I quote out the Step="@GraphStepTime" definition from the .razor file. It's just that like you can see from the code above, I'm requiring full timestamp strings yyyy-MM-dd HH:mm:ss.fff on the category axis, so by default, there are too many steps drawn and the texts become unreadable, overlapping each other a lot, as you can see below.

Please assist.

Strings are not allowed as steps - just numbers.

It's a TimeSpan, not a string. Changing it to an integer results in another exception:

image

You haven't provided the definitions of the step properties. The DateScale (Category axis) needs a TimeSpan step whereas the LinearScale (the Value axis) needs a number.

Sorry, what do you mean? I'm defining Step="@GraphStepTime", for the CategoryAxis, which is a TimeSpan. This is where the exception occurs. If I quote that out, the page runs fine, but with cluttered X axis values, as can be seen in the screenshot.

I am afraid I don't know what is causing this. We will need a reproduction. If you have a Radzen Professional subscription you can send us a sample project to info@radzen.com

Just to be sure I tested our line chart demo with a step. Seems to work fine.

...
    <RadzenCategoryAxis Padding="20" Step=@step />
...
@code {
   TimeSpan step = TimeSpan.FromDays(30);
}

I will try to track the bug down and prepare a sample project. I will get back to you later this week. (Although, no, I don't have a subscription, at least yet.)

I did some tests with a new project. It turns out that when the graphs are initialized statically at system startup, the bug does not appear. It appears only, when at startup, the graph data is empty, and the initialization of the graph data doesn't happen before OnAfterRenderAsync(). Also, interestingly, invoking StateHasChanged() in OnAfterRenderAsync() in the small test project means the bug does not appear.

I have quite a lot of initialization code on the page, and most of it needs to be called from another place as well, so I have implemented a function that takes care of the initialization. This function executes a couple of SQL queries, fetches data from an OPC UA interface, and reads settings from the local browser storage. So it takes a while to complete. It appears that at the same time, the line chart's own OnAfterRenderAsync() gets called, and since the graph initialization is not ready, there is no data for the graph(s) to draw, and this results in the exception with the declaration "Step must be a number".

The bug (it is a bug I think, since step is a number, or rather a timespan, and a valid one as well, as are the start and end time as well - even when there is no data) could be overcome by at least two means. First, it is possible to initialize the graphs statically with dummy data. Second, as I mentioned above, invoking StateHasChanged() at a proper location bypasses the bug as well.

So I did the following: I execute the SQL first, and get the graphs as a result. I invoke StateHasChanged() right after this, having valid graph data. I perform the rest of the initialization code, and invoke StateHasChanged() again. This bypasses the bug.

I don't know what's happening under the hood of course, but my personal opinion is that the chart should be able to render an empty graph area, even when there's a step defined. If this is explicitly not a desired behavior, then the exception message should match the issue and not lead the developer astray.

In any case, it's not a huge issue and I'm sure it will find a proper, lowish priority, should you decide to fix it at all.

Thanks for your time.

Just a note, I sent a sample project which you can use to reproduce the issue.

..and the bug is fixed. Another bunch of thanks via this channel! :smiley: