I would like to configure the Data of CategoryProperty (X Axis).
I was reading the documentation and it said that allows datetime and string, the example of line chart use string, mine initially uses datetime.
The problem: I set the date in this period of: “29/06/2024 00:00” and “29/06/2024 23:59” and in the chart showed just ‘29/06/2024’ in each point instead of the hours.
I tried to convert it to string but the graphic generated the Image bellow, configure step in , apply some custom formatters … but it does not work well.
How can I handle it? I would like set the date format according with the time difference like:
Less an hour: show ‘mm:ss’
Less a day: show ‘HH:mm’
Less a month: show ‘dd/MM’
...
Regards.
Hi @ggzucco,
Your best option is to convert the dates to a string. Getting all items in a single point would mean the category values are all the same.
I tried to convert to string
Model
public class SensorChartData
{
    public int IsActive { get; set;} // 0 Inactive | 1 Active
    public DateTime Date { get; set; } // I tested with public String Date { get; set; } that generated the second image
}
Backend
	public List<SensorChartData> ChartDataS { get; set; } = new List<SensorChartData>();

	private async Task GenerateGraphic()
	{
		.
		.
		.

		Timespan timeDifference = dtEnd - dtInitial;
		foreach (var sensorValue in sensorValueS)
		{
			ChartDataS.Add(new SensorChartData
			{
				IsActive = sensorValue.IsActive ? 1 : 0,
				//Date = sensorValue.DateTime
				Date = ConvertDateToString(timeDifference, sensorValue.DateTime);
			});
		}

		StateHasChanged();
	}


	private string ConvertDateToString(Timespan diff,  DateTime dt)
	{
		if(diff.hours < 1)
			return dt.ToString("mm:ss")
		else if(diff.days < 1)
			return dt.ToString("HH:mm")
		else if(diff.hours < 30)
			return dt.ToString("dd:MM")
		else if(diff.hours < 360)
			return dt.ToString("MMMM")
		else
			return dt.ToString("yyyy")
	}
	// maybe has some erros that I have to recreate it now for a notepad :sweat_smile:
Frontend
<RadzenChart>
                        <RadzenLineSeries Data="@ChartDataS"
                                          Title="@sensorName"
                                          LineType="LineType.Solid"
                                          CategoryProperty="Date"
                                          ValueProperty="IsActive">
                        </RadzenLineSeries>
                        <RadzenLegend Position="LegendPosition.Bottom" Visible="false" />
                        <RadzenCategoryAxis Padding="40"/>
                        <RadzenValueAxis Min="0" Max="1" Step="1">
                            <RadzenGridLines Visible="true" />
                        </RadzenValueAxis>
                    </RadzenChart>
but it generated the graphic os the second image
Blockquote the category values are all the same
so how i can handle this data to the chart not recognize as same value
Can you provide some sample data that you test with? If the strings are different then they should render as different category items. Here is a demo:
<RadzenChart>
<RadzenLineSeries Data="@data" CategoryProperty="Date" ValueProperty="IsActive">
</RadzenLineSeries>
<RadzenLegend Position="LegendPosition.Bottom" Visible="false" />
<RadzenCategoryAxis Padding="40"/>
<RadzenValueAxis Min="0" Max="1" Step="1">
<RadzenGridLines Visible="true" />
</RadzenValueAxis>
</RadzenChart>
@code {
public class SensorChartData
{
public int IsActive { get; set;} // 0 Inactive | 1 Active
public string Date { get; set; } // I tested with public String Date { get; set; } that generated the second image
}
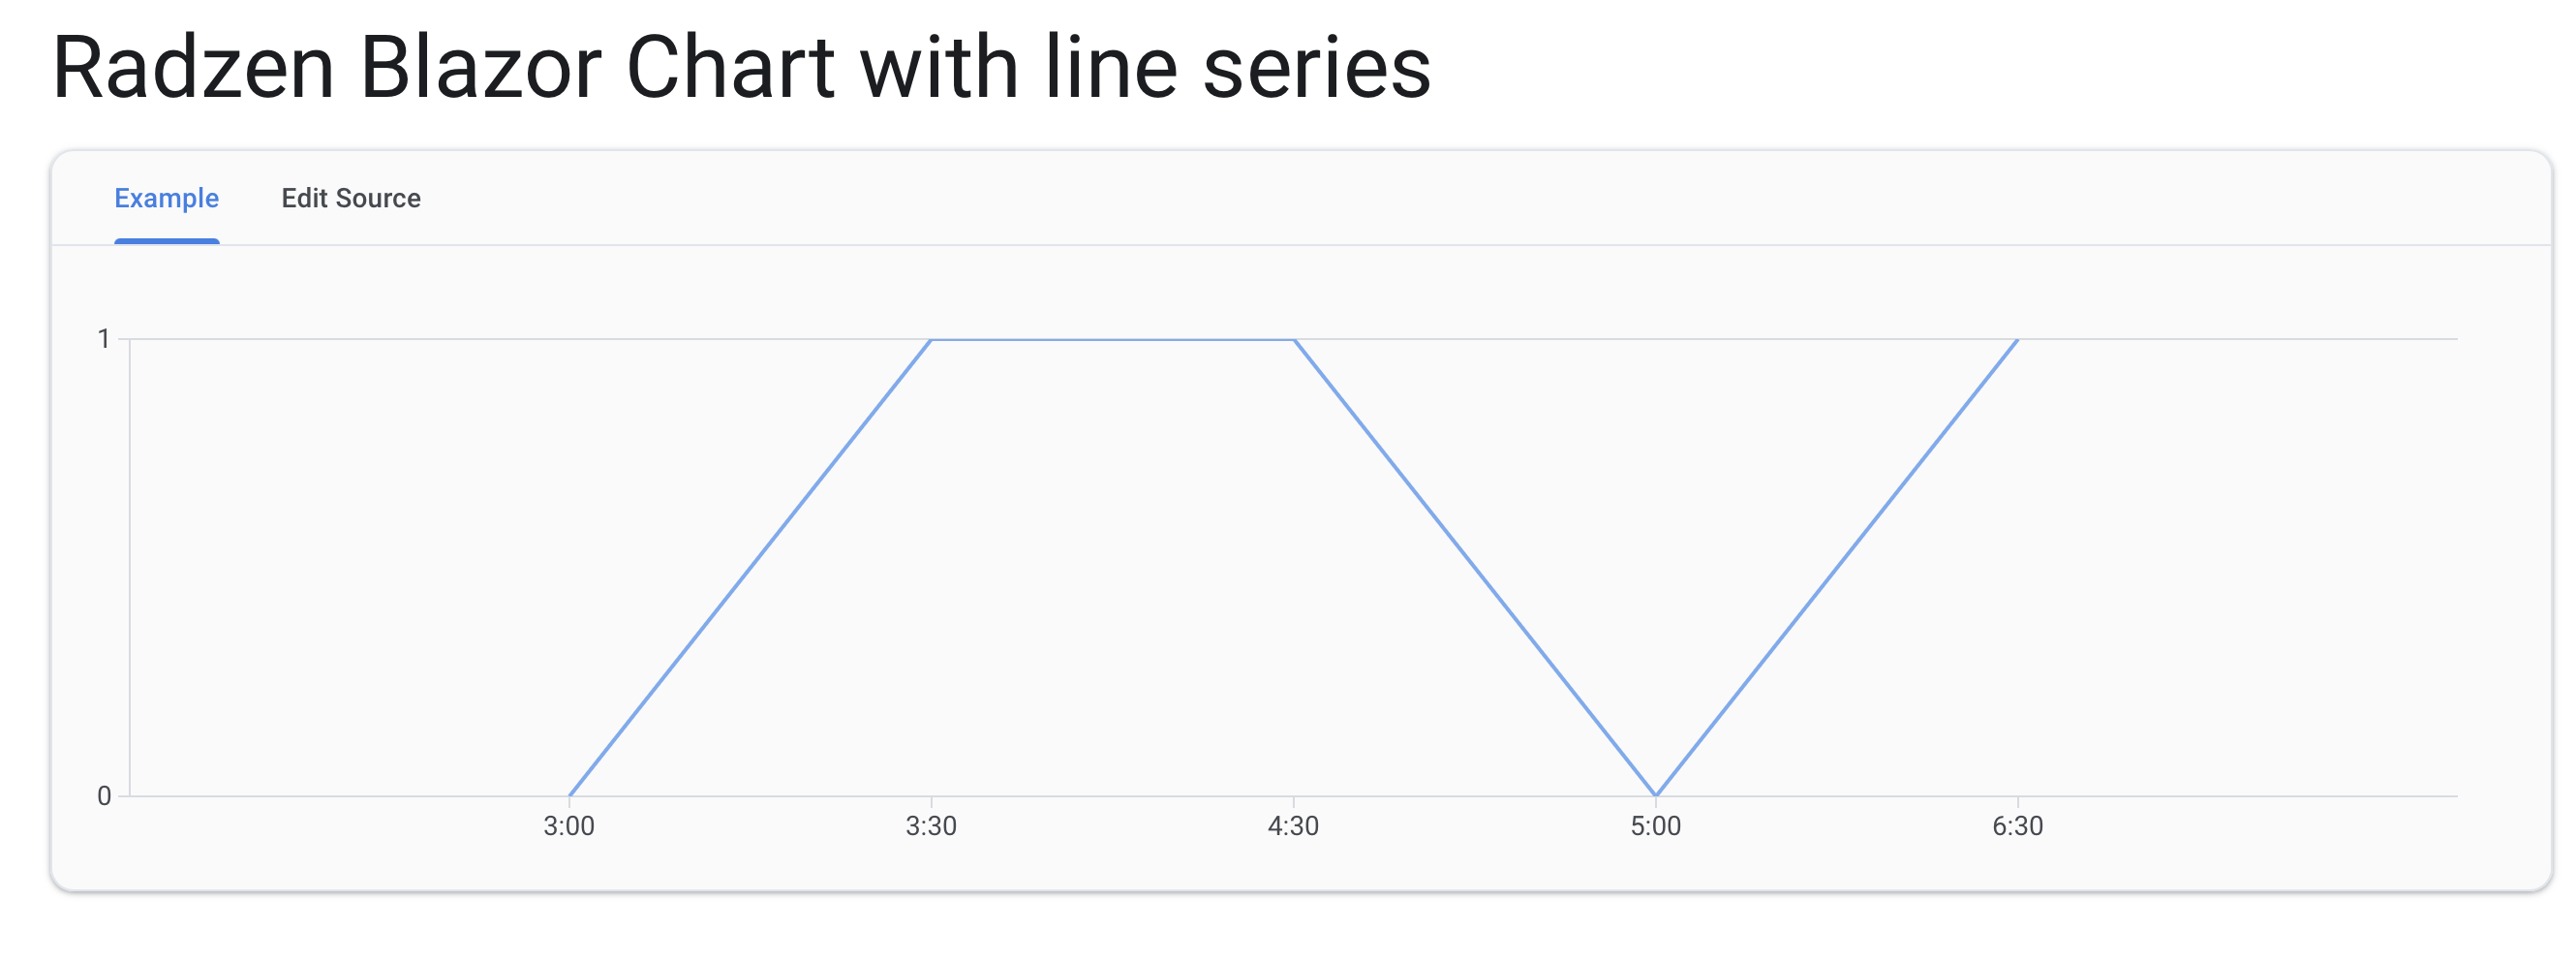
SensorChartData[] data = new [] {
new SensorChartData { IsActive = 0, Date = "3:00"},
new SensorChartData { IsActive = 1, Date = "3:30"},
new SensorChartData { IsActive = 1, Date = "4:30"},
new SensorChartData { IsActive = 0, Date = "5:00"},
new SensorChartData { IsActive = 1, Date = "6:30"}
};
}
    SensorChartData[] data = new [] {
        new SensorChartData { IsActive = 0, Date = "3:00"}, //dt.ToString("mm:ss")
        new SensorChartData { IsActive = 0, Date = "3:30"},
		new SensorChartData { IsActive = 1, Date = "3:30"},
		new SensorChartData { IsActive = 1, Date = "4:00"},
		new SensorChartData { IsActive = 1, Date = "4:00"},
        new SensorChartData { IsActive = 1, Date = "4:30"},
		new SensorChartData { IsActive = 0, Date = "4:30"},
        new SensorChartData { IsActive = 0, Date = "5:00"},
		new SensorChartData { IsActive = 0, Date = "5:00"},
    };
Well I have to duplicate the Date to do 'square wave', maybe it is the problem?
if yes, it has another way to do the square?
This is how the chart looks with your data:
Isn't this the desired output?
You can also check the interpolation demo. The Step mode could be what you need.
Ok the interpolation worked but the CategoryProperty Data continue weird
<RadzenChart>
    <RadzenLineSeries Data="@ChartDataS"
                      Title="@sensorName"
                      LineType="LineType.Solid"
                      CategoryProperty="Date"
                      ValueProperty="IsActive"
                  Interpolation="Interpolation.Step">
    </RadzenLineSeries>
    <RadzenLegend Position="LegendPosition.Bottom" Visible="false" />
    <RadzenCategoryAxis Padding="40"/>
    <RadzenValueAxis Min="0" Max="1" Step="1">
        <RadzenGridLines Visible="true" />
    </RadzenValueAxis>
</RadzenChart>

//-------------------------------------------------------------------------------
//Model
public partial class SensorChartData
{
    public int IsActive { get; set;}
    public string Date { get; set; }
}
I Made this mock
but it conutinues showing it
I will need a demo which demonstrates the problem. So far the provided code doesn't reproduce it.
Do you want a video or a link for the git?