The categories appear the same due to the formatting - they are actually different dates. Here is what happens if I change the FormatString to {0:dd/MM/yy}:
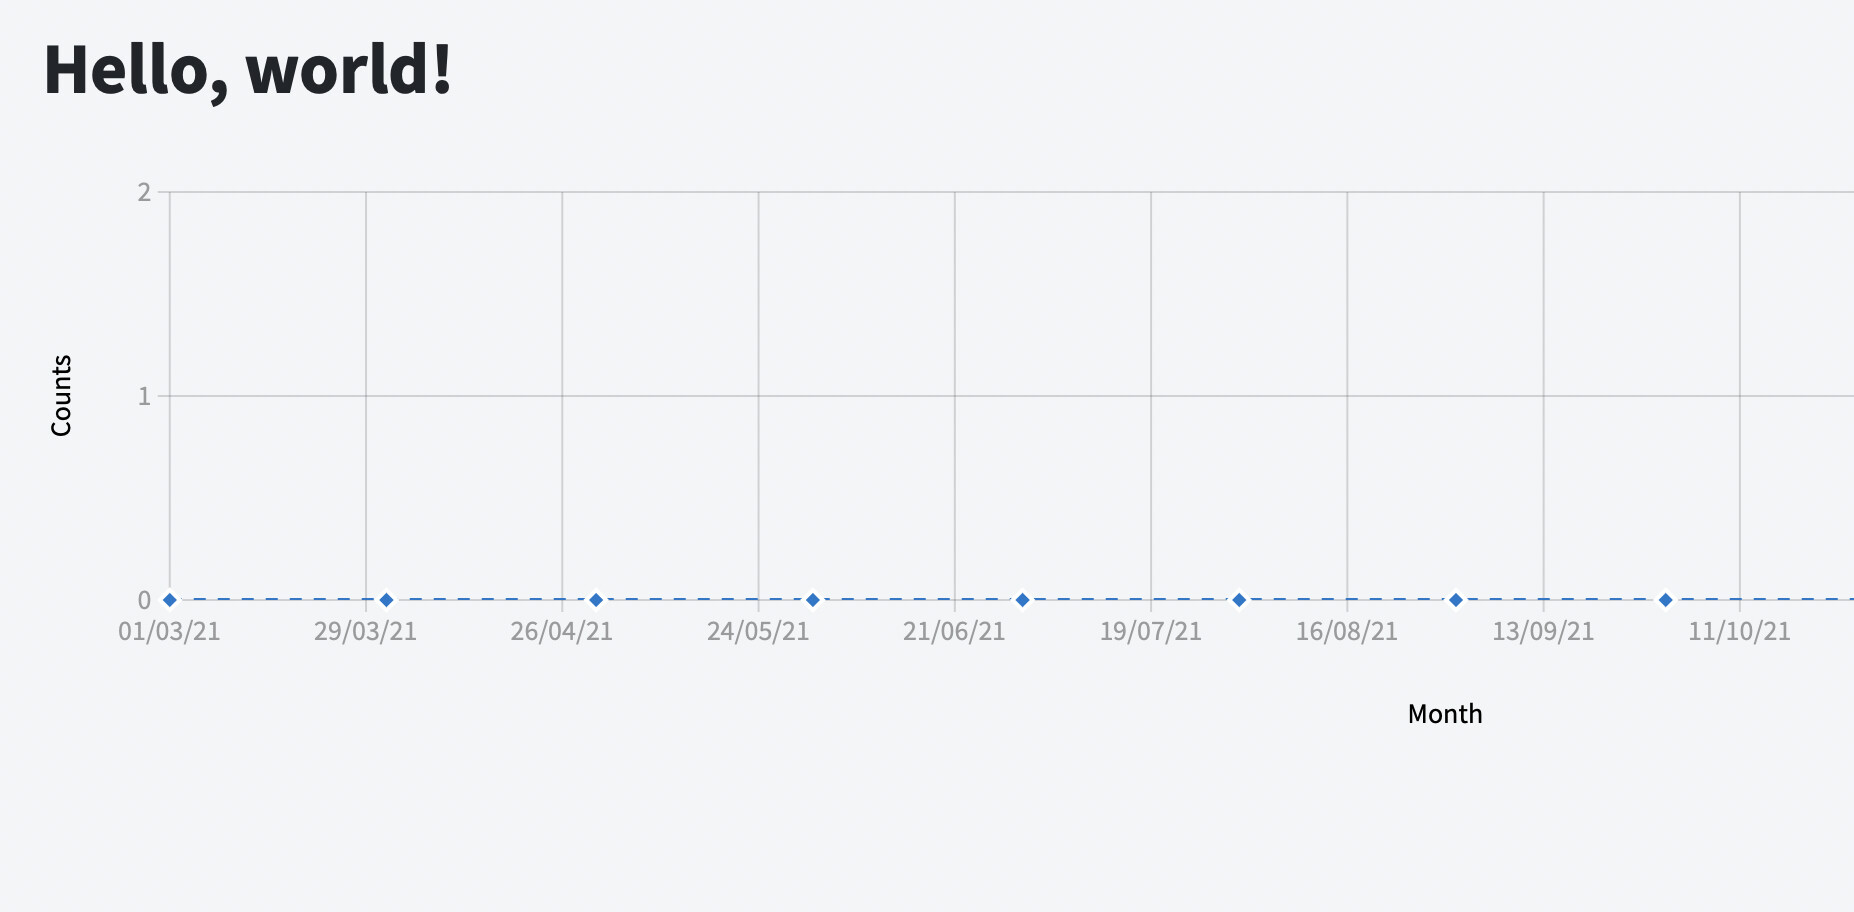
The RadzenChart interpolates between the dates from the series and picks an item for the category axis at equal interval. This behavior can be changed by setting the Step property of the Category - by default the step is pixel based in order to support responsive behavior. You can also convert the dates to strings and then the chart will use them as they are (without interpolation).
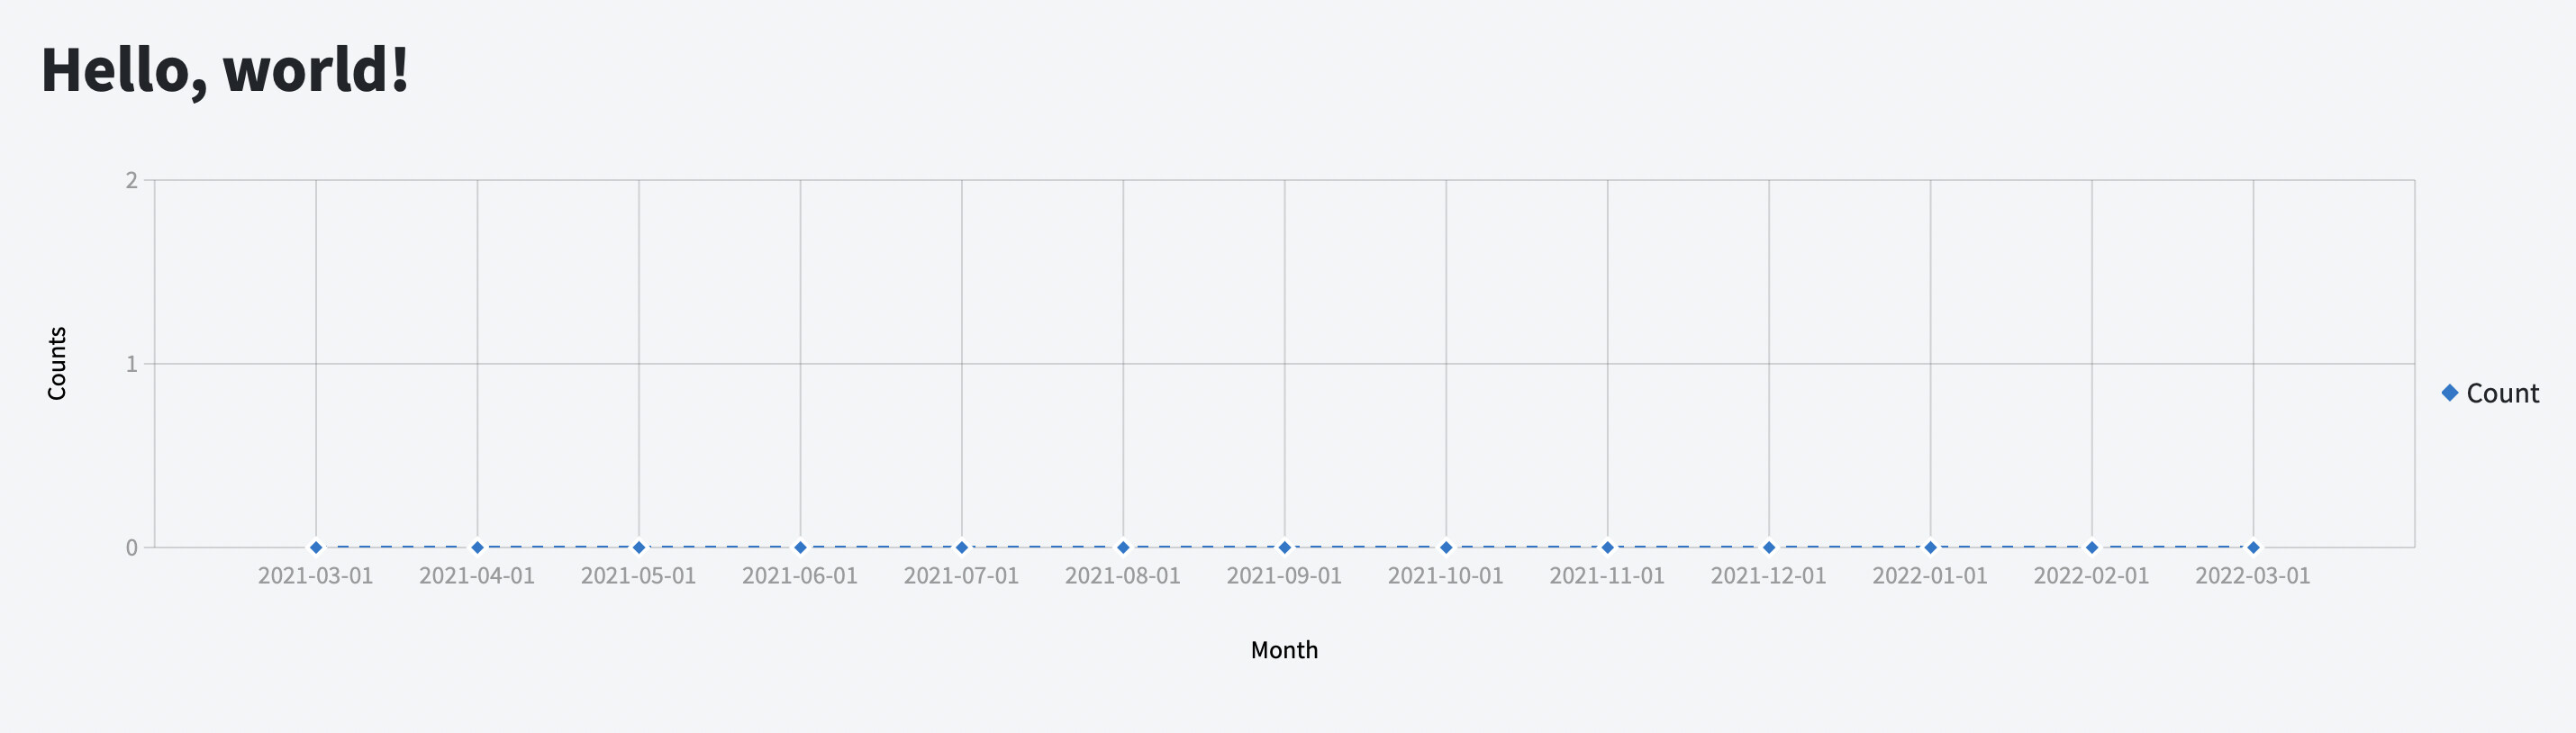
The latter used the following code:
@page "/"

<PageTitle>Index</PageTitle>

<h1>Hello, world!</h1>

<RadzenChart>
    <RadzenLineSeries Data="@DataItems" CategoryProperty="Date" Title="Count" LineType="LineType.Dashed" ValueProperty="Count">
        <RadzenMarkers MarkerType="MarkerType.Diamond" />
    </RadzenLineSeries>
    <RadzenCategoryAxis FormatString="{0:dd/MM/yy}">
        <RadzenGridLines Visible="true" />
        <RadzenAxisTitle Text="Month" />
    </RadzenCategoryAxis>
    <RadzenValueAxis>
        <RadzenGridLines Visible="true" />
        <RadzenAxisTitle Text="Counts" />
    </RadzenValueAxis>
</RadzenChart>

@code {
    class DataItem
    {
        public string Date { get; set; }
        public int Count { get; set; }
    }

    List<DataItem> DataItems => new List<DataItem>
    {
        new DataItem
        {
            Date = ("2021-03-01"),
            Count = 0,
        },
        new DataItem
        {
            Date = ("2021-04-01"),
            Count = 0,
        },
        new DataItem
        {
            Date = ("2021-05-01"),
            Count = 0,
        },
        new DataItem
        {
            Date = ("2021-06-01"),
            Count = 0,
        },
        new DataItem
        {
            Date = ("2021-07-01"),
            Count = 0,
        },
        new DataItem
        {
            Date = ("2021-08-01"),
            Count = 0,
        },
        new DataItem
        {
            Date = ("2021-09-01"),
            Count = 0,
        },
        new DataItem
        {
            Date = ("2021-10-01"),
            Count = 0,
        },
        new DataItem
        {
            Date = ("2021-11-01"),
            Count = 0,
        },
        new DataItem
        {
            Date = ("2021-12-01"),
            Count = 0,
        },
        new DataItem
        {
            Date = ("2022-01-01"),
            Count = 0,
        },
        new DataItem
        {
            Date = ("2022-02-01"),
            Count = 0,
        },
        new DataItem
        {
            Date = ("2022-03-01"),
            Count = 0,
        },
    };
}