Line chart Issue

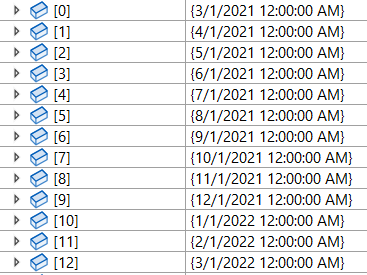
I've created a line chat using a collection of values per month, for simplicities sake in this example, all the y axis values are zero. The X axis month values are:
image

When I add these to a line chart, the first Y axis value (Mar 21) is repeated, and the next to last (Feb 22) is excluded:

Seems like there is a bug here?
Let me know if you need more info.

We will need a sample which would allow us to reproduce this problem - chart configuration and data (but not from a screenshot).

Here is a zip file with a demo project for the issue, its actually a lot worse in this basic project duplicating multiple categories. In this case though it only seems to be duplicating categories, not excluding them like it is in my actual project:
LineChartIssue.zip (194.4 KB)
Also it appears that only the first and last items line up with their actual category, thought this may just be a symptom of having the extra categories in the x axis.

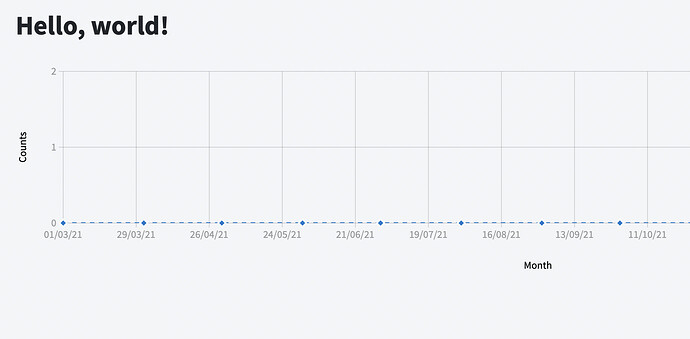
The categories appear the same due to the formatting - they are actually different dates. Here is what happens if I change the FormatString to {0:dd/MM/yy}:

The RadzenChart interpolates between the dates from the series and picks an item for the category axis at equal interval. This behavior can be changed by setting the Step property of the Category - by default the step is pixel based in order to support responsive behavior. You can also convert the dates to strings and then the chart will use them as they are (without interpolation).

The latter used the following code:

@page "/"

<PageTitle>Index</PageTitle>

<h1>Hello, world!</h1>

<RadzenChart>
    <RadzenLineSeries Data="@DataItems" CategoryProperty="Date" Title="Count" LineType="LineType.Dashed" ValueProperty="Count">
        <RadzenMarkers MarkerType="MarkerType.Diamond" />
    </RadzenLineSeries>
    <RadzenCategoryAxis FormatString="{0:dd/MM/yy}">
        <RadzenGridLines Visible="true" />
        <RadzenAxisTitle Text="Month" />
    </RadzenCategoryAxis>
    <RadzenValueAxis>
        <RadzenGridLines Visible="true" />
        <RadzenAxisTitle Text="Counts" />
    </RadzenValueAxis>
</RadzenChart>

@code {
    class DataItem
    {
        public string Date { get; set; }
        public int Count { get; set; }
    }

    List<DataItem> DataItems => new List<DataItem>
    {
        new DataItem
        {
            Date = ("2021-03-01"),
            Count = 0,
        },
        new DataItem
        {
            Date = ("2021-04-01"),
            Count = 0,
        },
        new DataItem
        {
            Date = ("2021-05-01"),
            Count = 0,
        },
        new DataItem
        {
            Date = ("2021-06-01"),
            Count = 0,
        },
        new DataItem
        {
            Date = ("2021-07-01"),
            Count = 0,
        },
        new DataItem
        {
            Date = ("2021-08-01"),
            Count = 0,
        },
        new DataItem
        {
            Date = ("2021-09-01"),
            Count = 0,
        },
        new DataItem
        {
            Date = ("2021-10-01"),
            Count = 0,
        },
        new DataItem
        {
            Date = ("2021-11-01"),
            Count = 0,
        },
        new DataItem
        {
            Date = ("2021-12-01"),
            Count = 0,
        },
        new DataItem
        {
            Date = ("2022-01-01"),
            Count = 0,
        },
        new DataItem
        {
            Date = ("2022-02-01"),
            Count = 0,
        },
        new DataItem
        {
            Date = ("2022-03-01"),
            Count = 0,
        },
    };
}
Ah, I see, that makes sense then, I will change those to strings.
Thank you for your assistance.

I am facing this issue ,even after having this <RadzenGridLines Visible= true/> in latest 5.6.12 version? Could you pl reply any fixes for this

<RadzenGridLines Visible= true/> is not the fix of the issue discussed here. The problem was using DateTime property as category and a format string which made all items look the same. Check if this is not the case with your app.

Sorry I have replied in wrong chart. But the horizontal gridlines isnt working for me .I have edited the commented could you pl have a look to this

`


`

I don't really see anything. Try reproducing the problem in our online demos - they are editable. Alternatively if you have a subscription you can send us your app to info@radzen.com.