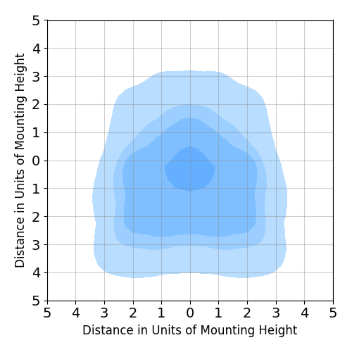
Is there a way (or anything planned) to display an isoilluminance graph?
The following is an example of one, where it shows the light distribution from a luminaire.
This usually takes in X,Y coordinate but there are not negative number in either axis. In the background there can be a -5 to facilitate drawing but the user would se basically from starting point (0) to 5 meters to the left or right, then there would the a certain value at a given X,Y coordinate, and that value would fall under a bracket of values which defines the colour, i.e. >5 is blue >10 is a darker blue and so on.