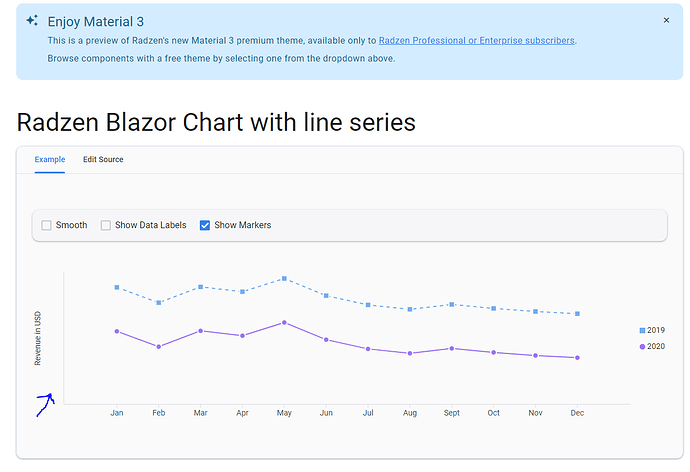
From the line chart demo, I have added a Min as the max value and the Max as the min value, because I would like to dynamically invert the Y axis, but when I do this, the horizontal grid line disappear and also the values on the Y axis disappear
code:
@using System.Globalization

<div class="container">
    <div class="row">
        <div class="col-sm-12 my-5">
            <RadzenCard class="w-100 mb-4" Style="display: flex; align-items: center; gap: 0.5rem" >
                <RadzenCheckBox @bind-Value="@smooth" Name="smooth"></RadzenCheckBox>
                <RadzenLabel Text="Smooth" Component="smooth" Style="margin-right: 1rem;"/>
                <RadzenCheckBox @bind-Value="@showDataLabels" Name="dataLabels"></RadzenCheckBox>
                <RadzenLabel Text="Show Data Labels" Component="dataLabels" Style="margin-right: 1rem;" />
                <RadzenCheckBox @bind-Value="@showMarkers" Name="markers"></RadzenCheckBox>
                <RadzenLabel Text="Show Markers" Component="markers" />
            </RadzenCard>
            <RadzenChart>
                <RadzenLineSeries Smooth="@smooth" Data="@revenue2019" CategoryProperty="Date" Title="2019" LineType="LineType.Dashed" ValueProperty="Revenue">
                    <RadzenMarkers Visible="@showMarkers" MarkerType="MarkerType.Square" />
                    <RadzenSeriesDataLabels Visible="@showDataLabels" />
                </RadzenLineSeries>
                <RadzenLineSeries Smooth="@smooth" Data="@revenue2020" CategoryProperty="Date" Title="2020" ValueProperty="Revenue">
                    <RadzenMarkers Visible="@showMarkers" MarkerType="MarkerType.Circle" />
                    <RadzenSeriesDataLabels Visible="@showDataLabels" />
                </RadzenLineSeries>
                <RadzenCategoryAxis Padding="20" Formatter="@FormatAsMonth" />
                <RadzenValueAxis Min="500000" Max="200000" Step="80000" Formatter="@FormatAsUSD">
                    <RadzenGridLines Visible="true" />
                    <RadzenAxisTitle Text="Revenue in USD" />
                </RadzenValueAxis>
            </RadzenChart>
        </div>
    </div>
</div>
I'm I doing something wrong or is this some sort of bug?
