Integrating Syncfusion Charts into Radzen Bazor application (server side)
- Add required components to your project
Syncfusion tools include Visual Studio option to integrate these tools into your project, so this is the simplest approach:
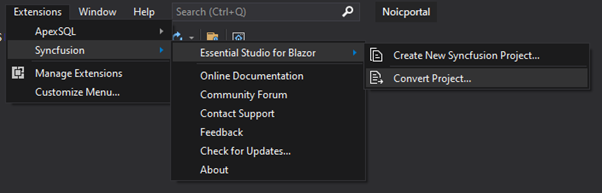
Select version and theme, then select “Convert”
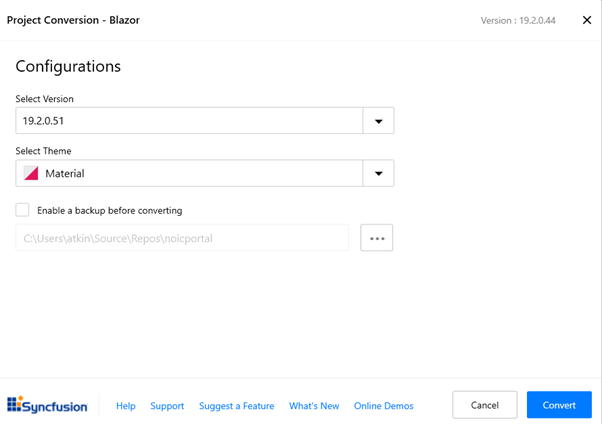
Two key files are updated:
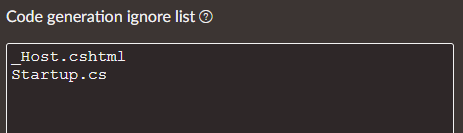
server/Pages/_Host.cshtml
server/Startup.cs
If you will be using features such as tooltips, you will need to include ajax in the _Host.cshtml file, this is not automatically included:
- Add these files to the code generation ignore list in Radzen:
You are now ready to incorporate Syncfusion charts in your project.
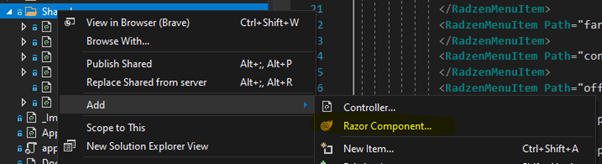
- Create a component in the Shared folder. To do this, right click on the Shared folder and select Add -> Razor Component:
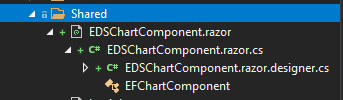
Give your component file a suitable name. We are creating a server side application, so next add two additional .cs files to this folder:
Component.razor
Component.razor.cs
Component.razor.designer.cs
Eg:
Ensure that the class definition in these two .cs files are defined as “partial”:
public partial class EDSChartComponent
{
}
-
Add your Syncfusion licence key to the Startup.cs file:
public void Configure(IApplicationBuilder app, IWebHostEnvironment env, ApplicationIdentityDbContext identityDbContext)
{
//Register Syncfusion license
Syncfusion.Licensing.SyncfusionLicenseProvider.RegisterLicense("…");
Note that Syncfusion offers a community license for small project teams. -
Create your first chart.
Open the Component.razor file in Visual Studio and add in your required Syncfusion chart definition. The following is an example from the Syncfusion samples (for testing we are including the required code in the same file:
@using Syncfusion.Blazor.Charts
EDSChartComponent
<ChartSeriesCollection>
    <ChartSeries DataSource="@DataSource" StackingGroup="Group1" XName="X" YName="YValue" Type="ChartSeriesType.StackingColumn">
    </ChartSeries>
    <ChartSeries DataSource="@DataSource" StackingGroup="Group1" XName="X" YName="YValue1" Type="ChartSeriesType.StackingColumn">
    </ChartSeries>
    <ChartSeries DataSource="@DataSource" StackingGroup="Group2" XName="X" YName="YValue2" Type="ChartSeriesType.StackingColumn">
    </ChartSeries>
</ChartSeriesCollection>
public List<ChartData> DataSource = new List<ChartData>
{
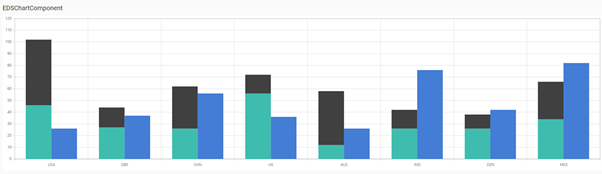
new ChartData { X= "USA", YValue= 46, YValue1=56, YValue2=26},
new ChartData { X= "GBR", YValue= 27, YValue1=17, YValue2=37},
new ChartData { X= "CHN", YValue= 26, YValue1=36, YValue2=56},
new ChartData { X= "UK", YValue= 56, YValue1=16, YValue2=36},
new ChartData { X= "AUS", YValue= 12, YValue1=46, YValue2=26},
new ChartData { X= "IND", YValue= 26, YValue1=16, YValue2=76},
new ChartData { X= "DEN", YValue= 26, YValue1=12, YValue2=42},
new ChartData { X= "MEX", YValue= 34, YValue1=32, YValue2=82 },
};
}
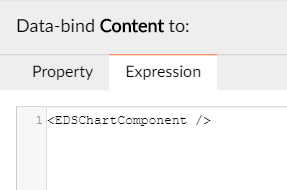
- Include this component in your Radzen project via the IDE. Simplest test is to create a blank page add an HTML element and include the following element (using the appropriate component name, as defined above):
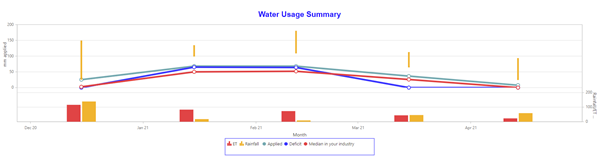
- Build and run your application in order to test all is well. You should see a chart like this:
-
We can now move the C# code onto the designer.cs file and pass this data through to the component from the server.
Edit the Component.razor.desiger.cs file and move the code from the Component.razor file, eg:
namespace Noicportal.Shared
{
public partial class EDSChartComponent
{
public class ChartData
{
public string X { get; set; }
public double YValue { get; set; }
public double YValue1 { get; set; }
public double YValue2 { get; set; }
}public List<ChartData> DataSource = new List<ChartData> { new ChartData { X= "USA", YValue= 46, YValue1=56, YValue2=26}, new ChartData { X= "GBR", YValue= 27, YValue1=17, YValue2=37}, new ChartData { X= "CHN", YValue= 26, YValue1=36, YValue2=56}, new ChartData { X= "UK", YValue= 56, YValue1=16, YValue2=36}, new ChartData { X= "AUS", YValue= 12, YValue1=46, YValue2=26}, new ChartData { X= "IND", YValue= 26, YValue1=16, YValue2=76}, new ChartData { X= "DEN", YValue= 26, YValue1=12, YValue2=42}, new ChartData { X= "MEX", YValue= 34, YValue1=32, YValue2=82 }, };}
}
Delete the original C# code from the .razor file. -
Populate chart data from the database.
Clearly the end game is to read data from the database and use this to plot the chart. In the following example I am using code from my test project, rather than Syncfusion samples.
Edit the Radzen generated page razor.cs file. In my example I have created a page named “EdsChartTest” so the appropriate file will be “Pages/EdsChartTest.razor.cs”:
public partial class EdsChartTestComponent
{
[Inject]
Data.NoicDbContext NoicDbContext { get; set; }public IEnumerable<IrrigationData> GetEfficiencyData(int offTakeId) { var dataForOffTake = NoicDbContext.EfficiencyDataSummaries.Where(o => o.OffTakeId == offTakeId).Select(o => new IrrigationData() { Month = (DateTime)o.Month, applied = o.mmApplied ?? 0, median = o.Median ?? 0, deficit = o.ActualDeficit ?? 0, et = o.ET ?? 0, rain = o.Rainfall ?? 0, high = o.mmMax ?? 0, low = o.mmMin ?? 0 }); return dataForOffTake; }}
The EDSChartComponent.razor.designer.cs updated as follows (a few additional test components here from the Radzen help pages):
namespace Noicportal.Shared
{
public partial class EDSChartComponent
{
[Parameter]
public string Title { get; set; }[Parameter] public IEnumerable<IrrigationData> irrigationData { get; set; } [Parameter] public EventCallback<MouseEventArgs> Click { get; set; } void OnClick(MouseEventArgs args) { Click.InvokeAsync(args); } protected void ChartComponentClick(MouseEventArgs args) { Console.WriteLine("Chart component clicked!"); }}
public class IrrigationData
{
public DateTime Month { get; set; }
public decimal applied { get; set; }
public decimal deficit { get; set; }
public decimal median { get; set; }
public decimal high { get; set; }
public decimal low { get; set; }
public decimal et { get; set; }
public decimal rain { get; set; }}
} -
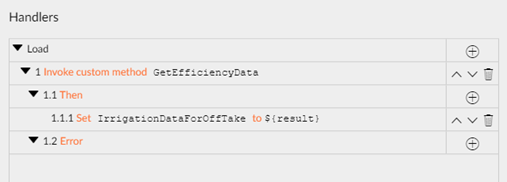
Using standard Radzen methods, create a suitable event handler to invoke this new custom method and assign the result to a suitable property.
- Update the HTML element to pass this data through to the component:
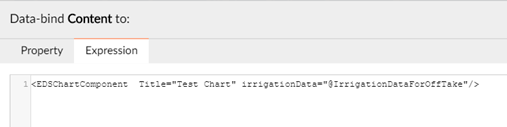
The DataSource for the Syncfusion chart definition is now “irrigationData” (refer parameter definition above), eg:
<ChartSeries Name ="Applied" DataSource ="@irrigationData" XName ="Month" YName ="applied" Type ="ChartSeriesType.Line" Width ="5" YAxisName ="Line">
<ChartMarker Visible ="true" Height ="10" Width ="10" />
</ChartSeries >
All being well you will end up with a chart populated with live data from your system.