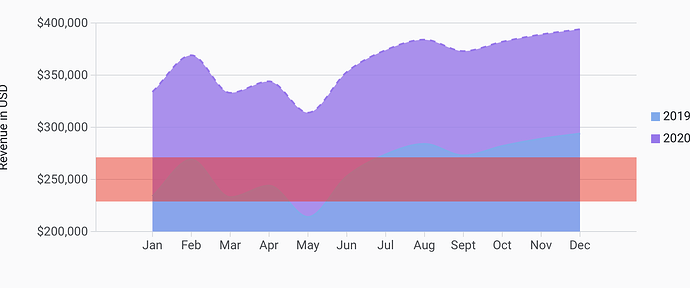
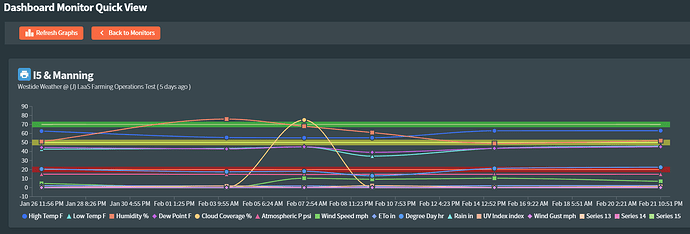
I have a chart with series lines that run the width of graph. I would like to make them with opacity at say .8 and have tried all HTML tricks to do so but they stay solid (so I'm assuming this is server only). Below is the chart with the 3 horizontal lines I would like semi transparent, anyone else do this?
Hi @Rod,
You can use rgba when setting the Stroke color:
<RadzenSeriesValueLine Value="250000" Stroke="rgba(255, 0, 0, 0.5)" StrokeWidth="50" />
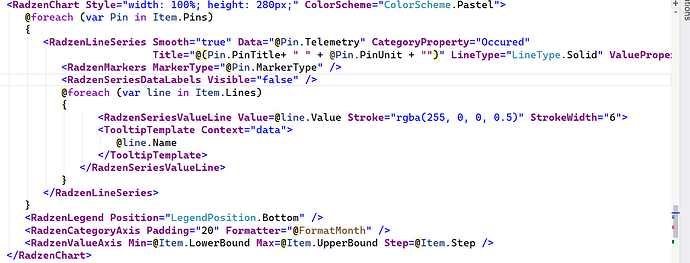
Thanks for the reply @korchev , I have tried the rgba() function with no luck. I have posted the chart with your line of code in it along with the source for generating the line chart below. Do you see any reason it would not work with opacity?
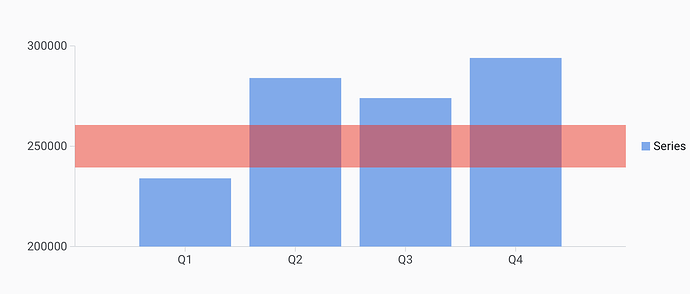
I can't test with your code as it is a screenshot. Here is a complete working example:
<div Class="rz-p-0 rz-p-md-12">
    <RadzenChart>
        <RadzenColumnSeries Data="@revenue1" CategoryProperty="Quarter" ValueProperty="Revenue">
            <RadzenSeriesValueLine Value="250000" Stroke="rgba(255, 0, 0, 0.5)" StrokeWidth="50">
                <TooltipTemplate>
                    250000
                </TooltipTemplate>
            </RadzenSeriesValueLine>
        </RadzenColumnSeries>
    </RadzenChart>
</div>

@code {
  class DataItem
  {
      public string Quarter { get; set; }
      public double Revenue { get; set; }
  }

  DataItem[] revenue1 = new DataItem[]
  {
      new DataItem { Quarter = "Q1", Revenue = 234000 },
      new DataItem { Quarter = "Q2", Revenue = 284000 },
      new DataItem { Quarter = "Q3", Revenue = 274000 },
      new DataItem { Quarter = "Q4", Revenue = 294000 }
  };
}
Also have in mind that if you have multiple series the line will go below series defined after them. You can use the RenderingOrder property to make the series that has RadzenSeriesValueLine render last so the line goes on top of all series.
 <RadzenColumnSeries RenderingOrder="1" Data="@revenue1" CategoryProperty="Quarter" ValueProperty="Revenue" >
            <RadzenSeriesValueLine Value="250000" Stroke="rgba(255, 0, 0, 0.5)" StrokeWidth="50">
                <TooltipTemplate>
                    250000
                </TooltipTemplate>
            </RadzenSeriesValueLine>
        </RadzenColumnSeries>
        <RadzenColumnSeries RenderingOrder="0" Data="@revenue1" CategoryProperty="Quarter" ValueProperty="Revenue"  />
</RadzenChart>
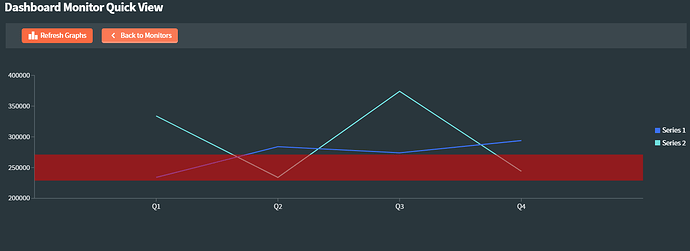
@korchev thank you, the rendering order 95% fixes my issue but it still will not render with opacity. I believe it works fine with RadzenColumnSeries charts but not with RadzenLineSeries charts. Have you bench tested it with Line Series charts?
Yes, it works:
<RadzenChart>
     <RadzenLineSeries RenderingOrder="1" Data="@revenue1" CategoryProperty="Quarter" ValueProperty="Revenue" >
            <RadzenSeriesValueLine Value="250000" Stroke="rgba(255, 0, 0, 0.5)" StrokeWidth="50">
                <TooltipTemplate>
                    250000
                </TooltipTemplate>
            </RadzenSeriesValueLine>
        </RadzenLineSeries>
        <RadzenLineSeries RenderingOrder="0" Data="@revenue2" CategoryProperty="Quarter" ValueProperty="Revenue"  />
</RadzenChart>

@code {
  class DataItem
  {
      public string Quarter { get; set; }
      public double Revenue { get; set; }
  }

  DataItem[] revenue1 = new DataItem[]
  {
      new DataItem { Quarter = "Q1", Revenue = 234000 },
      new DataItem { Quarter = "Q2", Revenue = 284000 },
      new DataItem { Quarter = "Q3", Revenue = 274000 },
      new DataItem { Quarter = "Q4", Revenue = 294000 }
  };

    DataItem[] revenue2 = new DataItem[]
  {
      new DataItem { Quarter = "Q1", Revenue = 334000 },
      new DataItem { Quarter = "Q2", Revenue = 234000 },
      new DataItem { Quarter = "Q3", Revenue = 374000 },
      new DataItem { Quarter = "Q4", Revenue = 244000 }
  };
}
I can see the lines behind - this means that opacity works. Not sure what you expect.
Yea I'm not representing what my issue is very good, the problem is, yes it does show on top of the series line but when say a yellow line crosses into a yellow series line, it disappears instead of XOR'ing color bits. I'll just keep experimenting as I'm sure it's something I am doing.
Thought I would post my results, it was my misunderstanding how value lines are processed. I studied existing code and now understand fully.
@korchev Couldn't be happier with the results!

