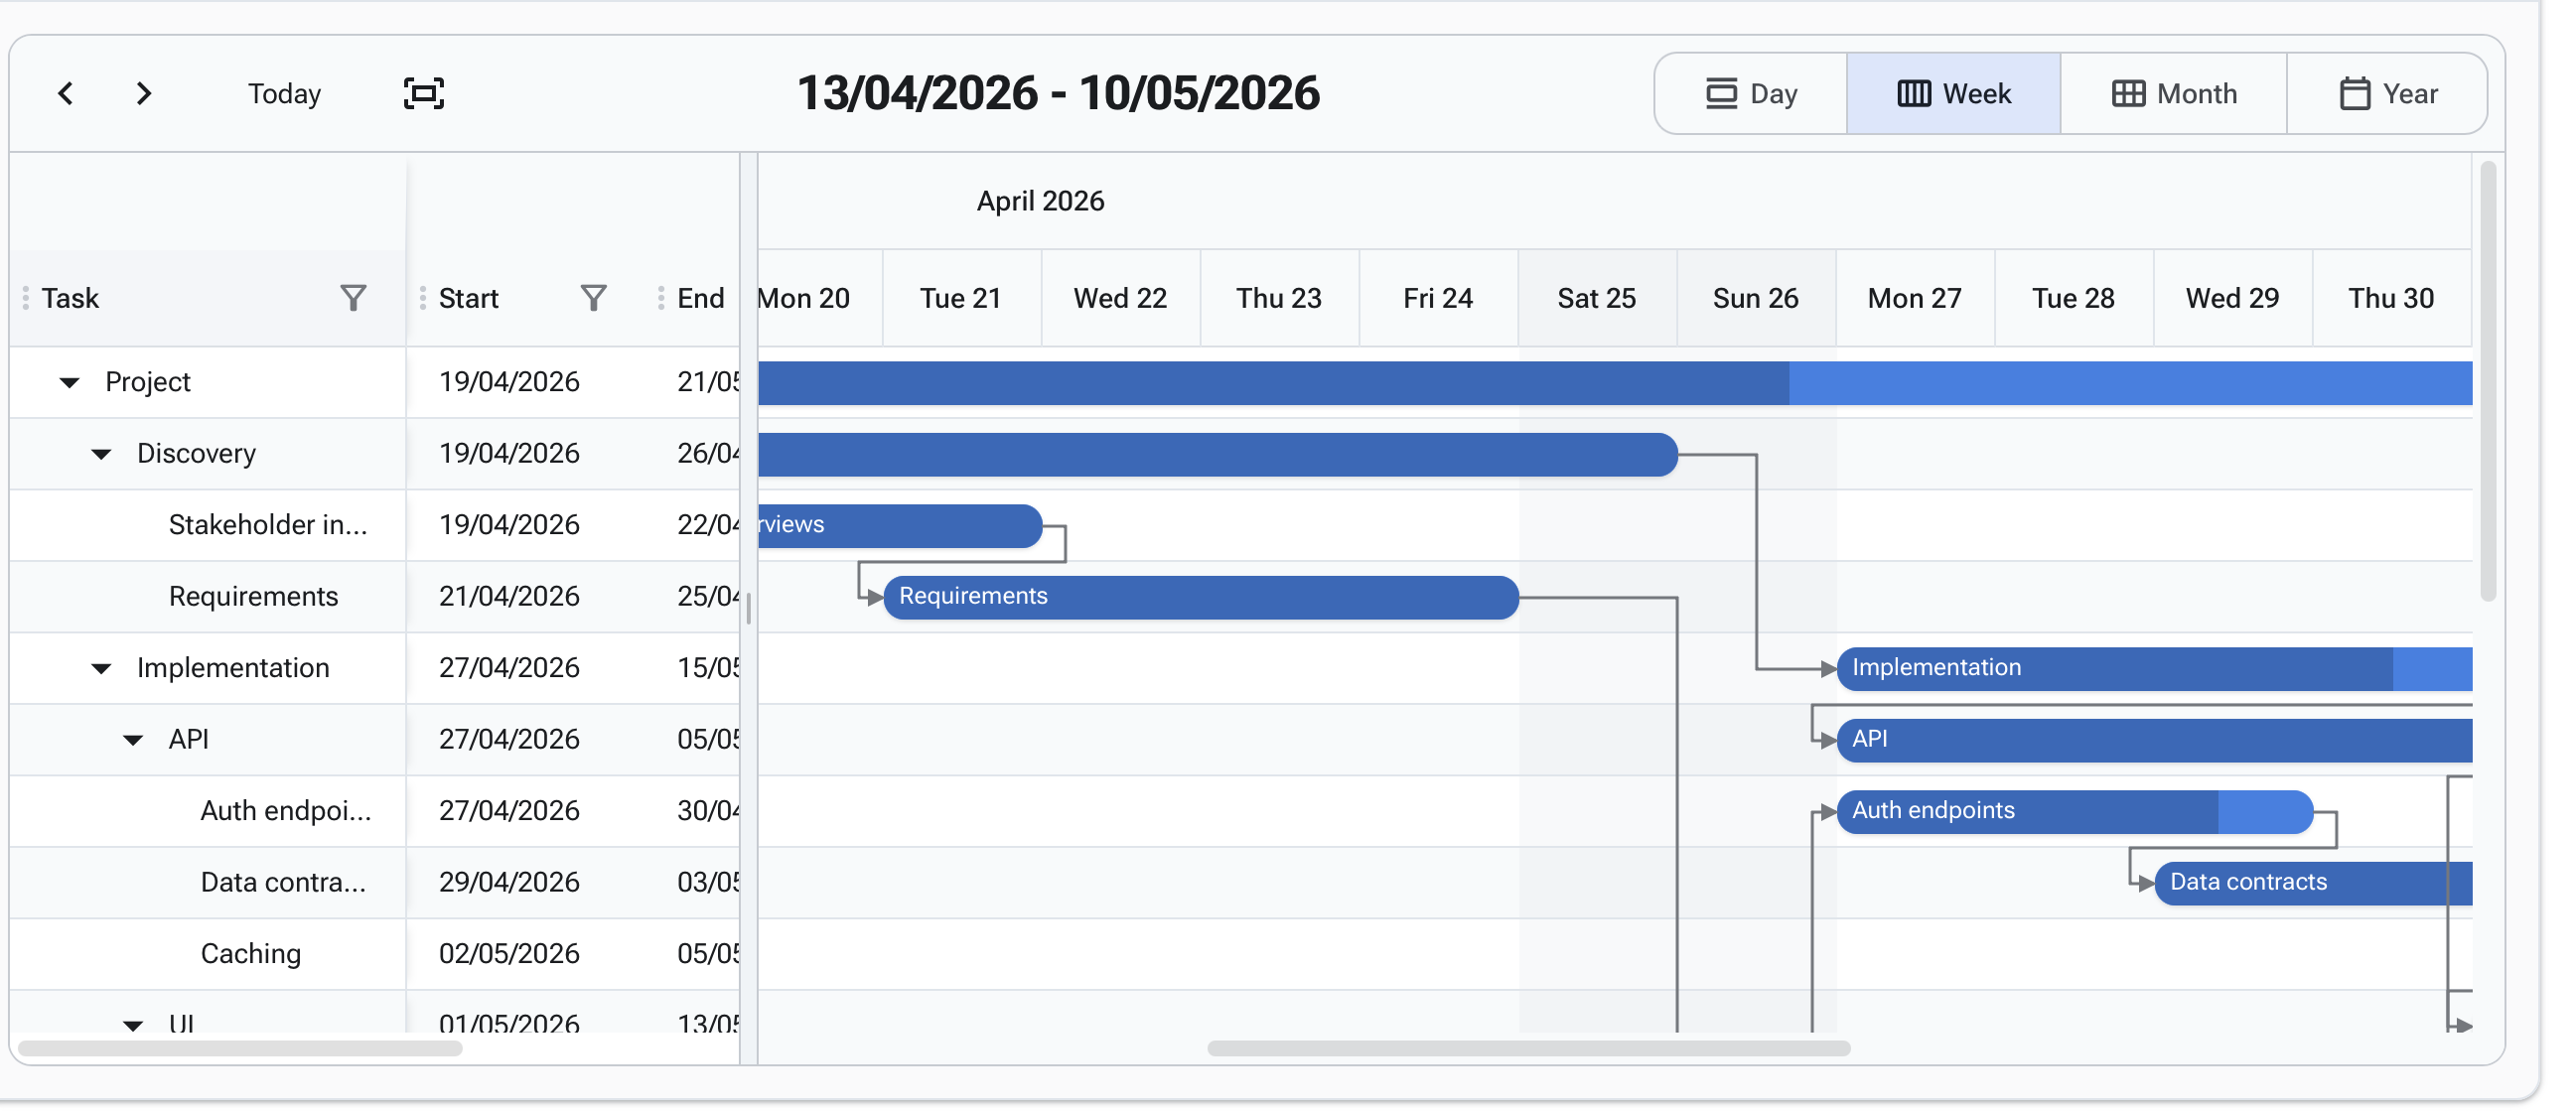
a GanntChart is a visual element that should show a project timelines and how much has been completed. the first part is there, but I do not seem to see the completion part in the timeline. am i missing something? is there something in the planning to complete this feature?
This is demonstrated in the very first demo:
Check the configuration from the source tab:
<RadzenGantt @ref="gantt" TItem="GanttTask"
             Data="@tasks"
             Dependencies="@dependencies"
             IdProperty="@nameof(GanttTask.Id)"
             ParentIdProperty="@nameof(GanttTask.ParentId)"
             TextProperty="@nameof(GanttTask.Name)"
             StartProperty="@nameof(GanttTask.Start)"
             EndProperty="@nameof(GanttTask.End)"
             ProgressProperty="@nameof(GanttTask.Progress)" <!-- Progress configuration -->
             Style="width: 100%; height: 520px;"
             AllowColumnResize="true" AllowColumnReorder="true">
so I missed it! but to my defense the colors used are too close to be clear.
may I suggest the following:
Colors are a matter of preference. For example I consider using red as a background to be inappropriate.
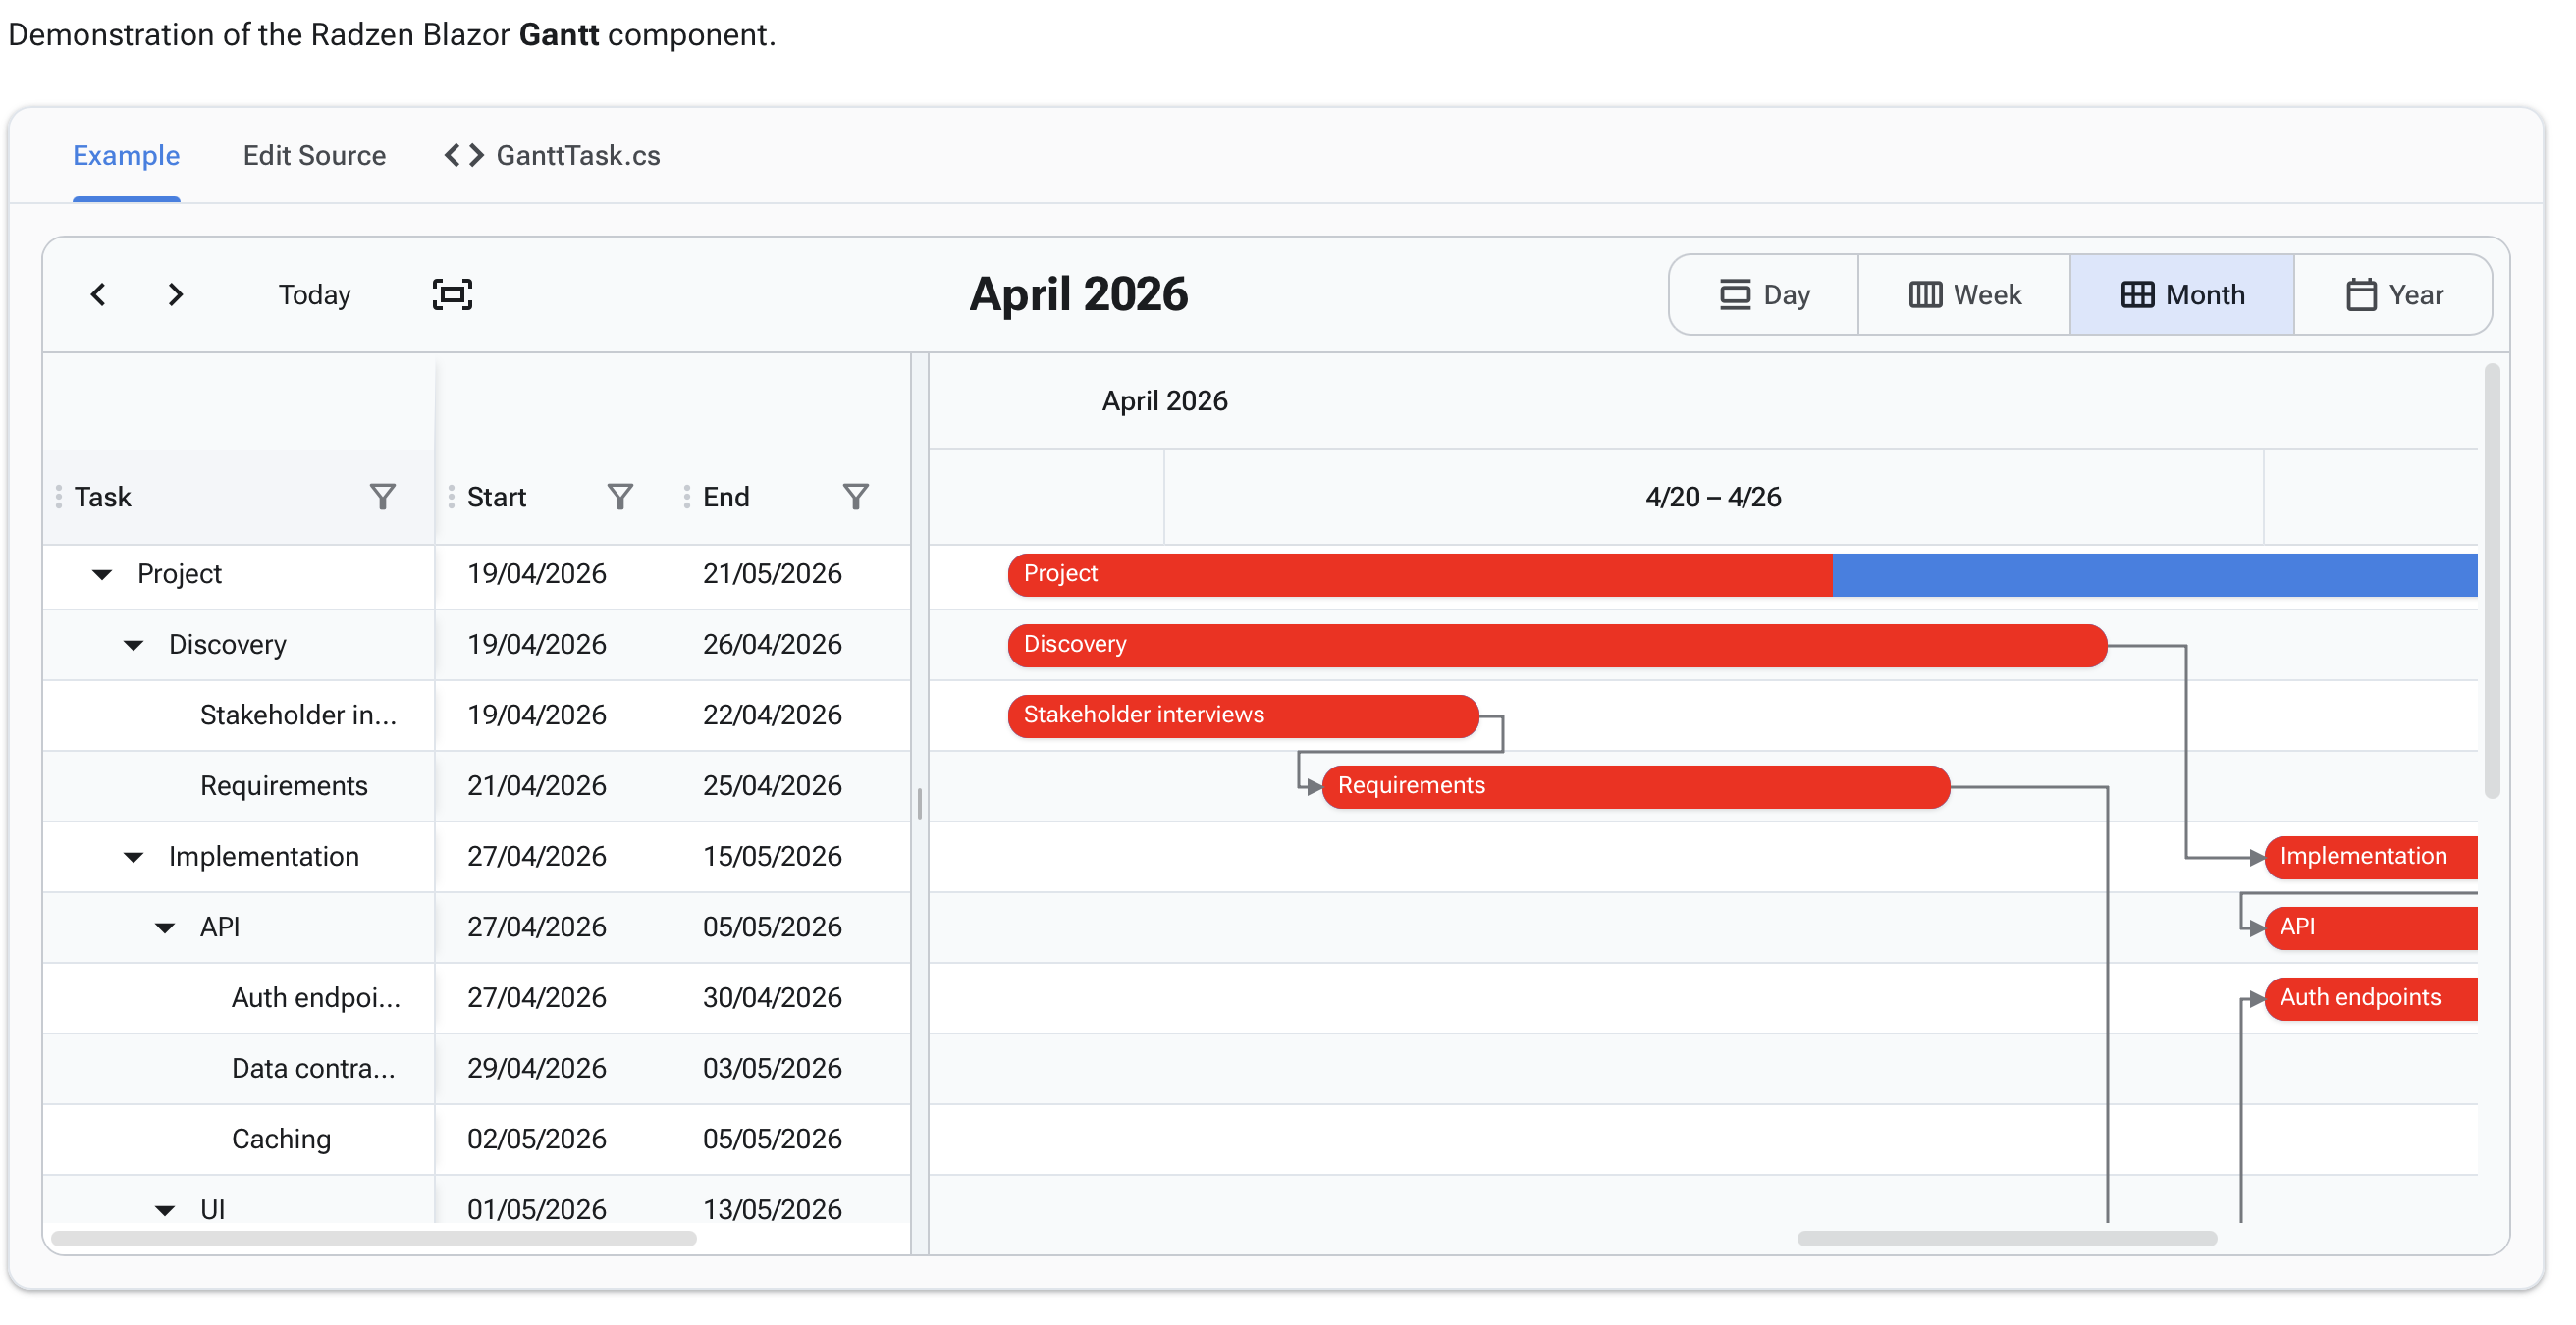
Still feel free to apply whatever customization you find is best.
I used red as a flagrant test, but I agree with you: it should be green logically. anyway whatever color you choose it is meant to be seen clearly. that was my point! that is why I missed it.