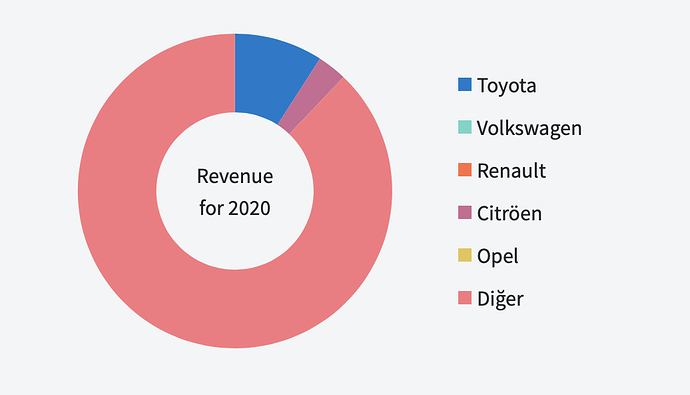
As you can see at the gif file(animated, told because it may seem not animating), the chart ruins instead of getting smaller by preserving its looking. How can I prevent the breaking? The graph gets fairly weird.
https://gfycat.com/colossalvillainouscanary


Hi @blazorstudent,
We will need to reproduce this problem somehow as we don't know what is causing it. You can show us the data (numeric values) that you use to populate the chart.
Thanks for your interest Mr.@korchev. That values are below.
t.CarRevenueChartList	{MyWebSite.Contract.DataItem[6]}	MyWebSite.Contract.DataItem[]
-		[0]	{MyWebSite.Contract.DataItem}	MyWebSite.Contract.DataItem
Description	"Toyota"	string
Value_decimal	5030.00	decimal
Value_int	3	int
-		[1]	{MyWebSite.Contract.DataItem}	MyWebSite.Contract.DataItem
Description	"Volkswagen"	string
Value_decimal	0.00	decimal
Value_int	0	int
-		[2]	{MyWebSite.Contract.DataItem}	MyWebSite.Contract.DataItem
Description	"Renault"	string
Value_decimal	0.00	decimal
Value_int	0	int
-		[3]	{MyWebSite.Contract.DataItem}	MyWebSite.Contract.DataItem
Description	"Citröen"	string
Value_decimal	2522.00	decimal
Value_int	1	int
-		[4]	{MyWebSite.Contract.DataItem}	MyWebSite.Contract.DataItem
Description	"Opel"	string
Value_decimal	0.00	decimal
Value_int	0	int
-		[5]	{MyWebSite.Contract.DataItem}	MyWebSite.Contract.DataItem
Description	"Diğer"	string
Value_decimal	22788.00	decimal
Value_int	29	int
How I use the component,
<div class="col-md-4">
    <div class="card card-info">
        <div class="card-header">
            <div class="card-tools">
                <button type="button" class="btn btn-tool" data-card-widget="collapse">
                    <i class="fas fa-minus"></i>
                </button>
                <button type="button" class="btn btn-tool" data-card-widget="remove">
                    <i class="fas fa-times"></i>
                </button>
            </div>
        </div>
        <div class="card-body">
        <!-- radzen part --><!-- radzen part --><!-- radzen part --><!-- radzen part -->
            <RadzenChart>
                <RadzenDonutSeries Data="@MainPageStatResponse.CarRevenueChartList" CategoryProperty="Description" ValueProperty="Value_int">

                    <TooltipTemplate Context="data">
                        <div>
                            <span>@data.Value_int Araç</span>
                            <strong>@data.Value_decimal.ToString("N2") ₺</strong>
                        </div>
                    </TooltipTemplate>

                </RadzenDonutSeries>
            </RadzenChart>
        <!-- radzen part --><!-- radzen part --><!-- radzen part --><!-- radzen part -->
        </div>
        <!-- /.card-body -->
    </div>
</div>
The website actually takes advantage of https://adminlte.io/themes/v3/ template. I don't know whether it is related. However, even if I remove all css tags which are between <style></style> tags except that of radzen in the page in which the graphs are there, I run into same issue.
Everything looks normal at my end - the chart appears as expected:
The issue is somehow related to the size - try setting Style="width: 100%" to <RadzenChart> and hopefully it would make a difference.
@korchev do you mean the following ( the first line, if so, nothing is changed, same issue ) ?
Or the RadzenChart's inside somewhere?
<div class="card-body" style="width: 100% !important"> <!-- <------- -->
                        <RadzenChart>
                            <RadzenDonutSeries Data="@MainPageStatResponse.CarRevenueChartList" CategoryProperty="Description" ValueProperty="Value_int">


                                <TooltipTemplate Context="data">
                                    <div>
                                        <span>@data.Value_int Araç</span>
                                        <strong>@data.Value_decimal.ToString("N2") ₺</strong>
                                    </div>
                                </TooltipTemplate>
                            </RadzenDonutSeries>
                        </RadzenChart>
                    </div>
<RadzenChart Style="width: 100%">
I have applied the code but the result is same. I think it is a kind of bug. For example, GitHub - mariusmuntean/ChartJs.Blazor: Brings Chart.js charts to Blazor doesn't yield the issue. Can you fix the bug?
We can only fix issues that we can reproduce.
@korchev you can produce the issue if you can use adminlte on blazor. Anyway, we see your approaches such issues. Thanks.
Hi @blazorstudent,
If you have a Radzen Professional and Enterprise subscription you can send us your application to info@radzen.com and will will troubleshoot if there is any conflict with that third party theme. Otherwise we can't do much until we reproduce the problem.


