Define custom color for each column in Radzen Column chart

Hi.

I would like to specify custom color for each column in Radzen Column Chart or have random colors auto-generated, how can I do that?

projectStatus = new[]
{
	new DataItem()
	{
		Status = "Open"
		Projects = projects.Count(x => x.ProjectStatus == ProjectStatus.OPEN)
	},
	new DataItem()
	{
		Status = "Closed"
		Projects = projects.Count(x => x.ProjectStatus == ProjectStatus.CLOSED)
	},
	
	//...
};

Chart:

<div class="container">
    <div class="row">
        <div class="col-sm-12 my-5">
            <RadzenChart>
                <RadzenColumnSeries Data="@projectStatus" 
                                    CategoryProperty="Status" 
                                    Title="Projects" 
                                    LineType="LineType.Dashed" 
                                    ValueProperty="Projects">
                    <RadzenSeriesDataLabels Visible="@showDataLabels" />
                </RadzenColumnSeries>
                <RadzenColumnOptions Radius="5" />
                <RadzenValueAxis Min="0" 
                                 Max="@maxValue"/>
            </RadzenChart>
        </div>
    </div>
</div>

Result:
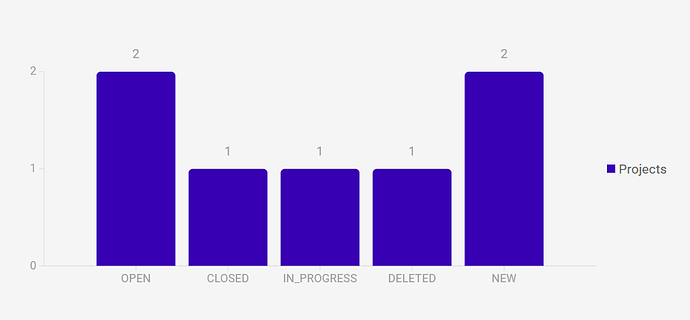
Hi @Ibrahim_Tamimi,

Try setting the Fills property of RadzenColumnSeries:

<RadzenColumnSeries Data="@projectStatus" 
        Fills="@(new [] { "#ccbbdd", "red", "green" })"
                                    CategoryProperty="Status" 
                                    Title="Projects" 
                                    LineType="LineType.Dashed" 
                                    ValueProperty="Projects">
4 Likes

It works. Thank you sir.

Is their a way to change the key as well we match the custom colors?

What is "the key"? I don't understand what you are after.

image
This is the Key or Legend