Hi Radzen,
I am trying to set breakpoints in the TypeScript code via Visual Code, is it possible?
Thanks
Hi Radzen,
I am trying to set breakpoints in the TypeScript code via Visual Code, is it possible?
Thanks
Hi @semafox,
It seems possible but requires a few extra steps due the fact that debugging TypeScript requires a web browser (VS Code supports natively only NodeJS debugging).
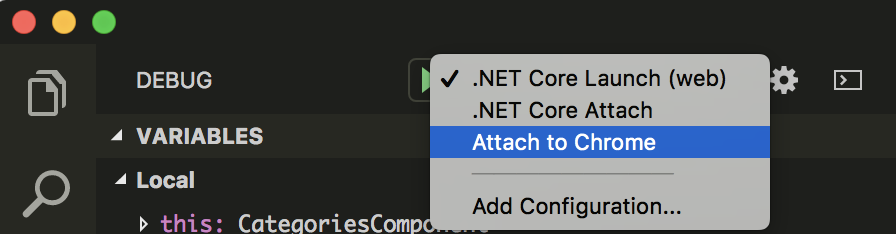
{
   "name": "Attach to Chrome",
   "type": "chrome",
   "request": "attach",
   "port": 9222,
   "webRoot": "${workspaceFolder}/../client/src/app"
}
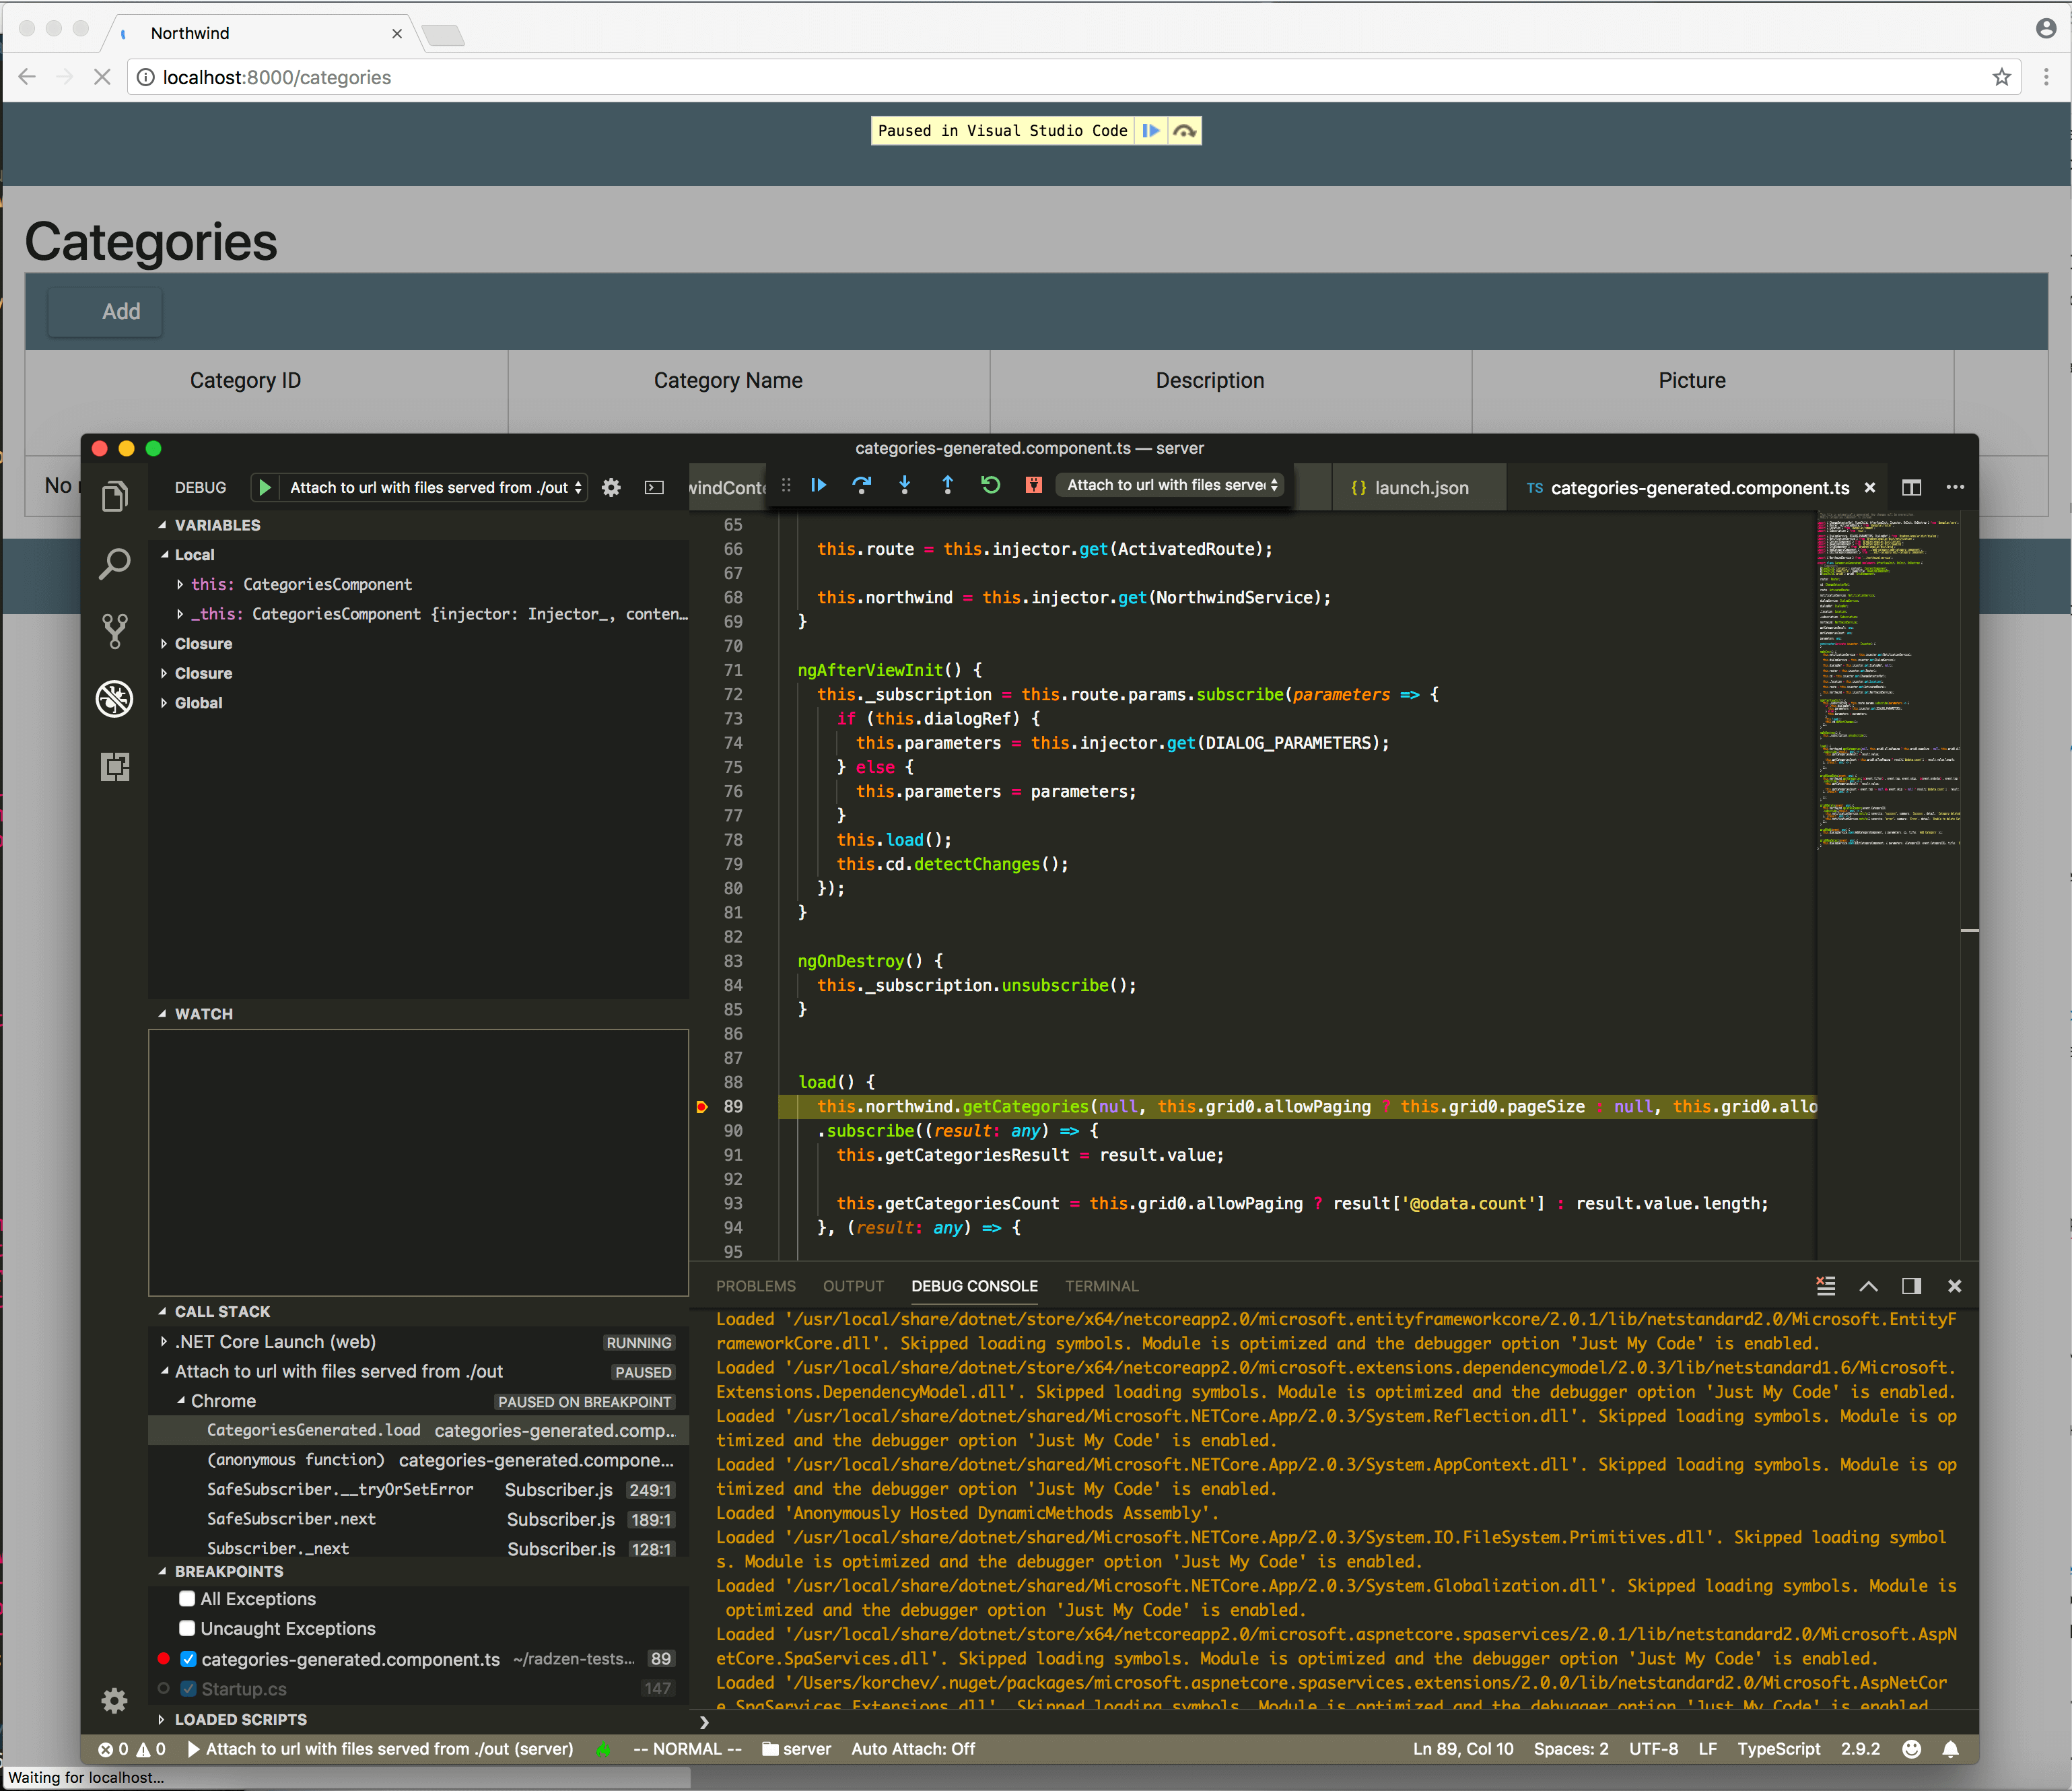
At last you can break in the TypeScript code ![]()
It looks a bit too much for my taste to be honest which is why I prefer debugging in Chrome directly as described in our docs.
Best regards,
Atanas
Sorry, I should have read the online doc better… Debugging via Chrome is perfectly fine!
Thanks