Up front, my apologies in that this question probably doesn't belong here. I've lost a lot of days on this and am hoping for some direction even if it is a different site to post on (tried stack overflow and received no responses)
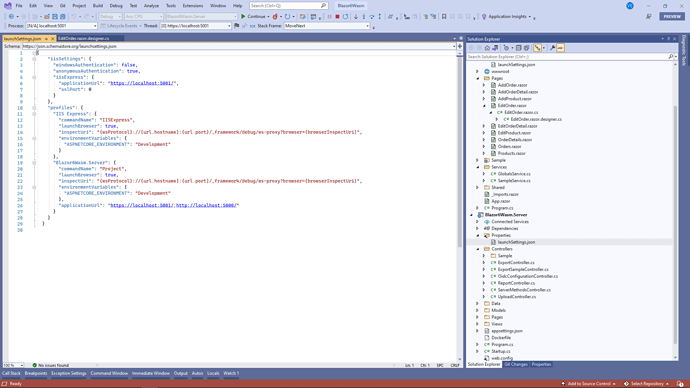
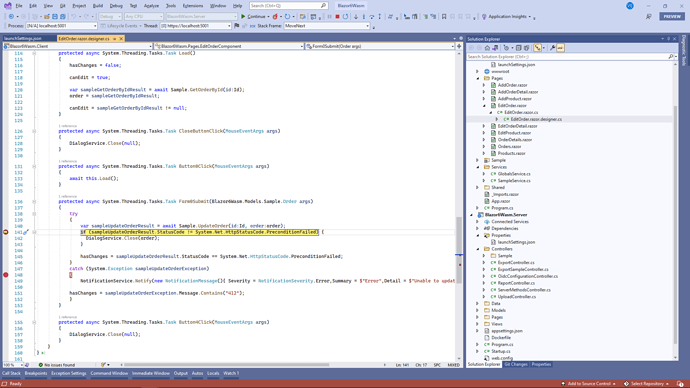
About a week ago my debugger began no longer stopping on breakpoints in the client application. It does stop on the server app.
At the same time this problem started, I noticed that when I started a debug session it started opening a new tab rather than a new window in Edge.
A few points:
- The behavior seems consistent between MS Edge and Chrome.
- If I create a new app, the new app appears to stop on breakpoints.
- List item
I am on VS 2022. Tried it on VS2019 on the same laptop with the same results.
List item
Been searching and finding little things to try here and there, but nothing has made a difference.
I can't think of any changes I have made to the environment, etc.
Sorry if off topic, hoping for some kind of guidance.

