Hello everyone,
Currently I am trying to implement a datagrid and a chart, but both must share the same source.
  <RadzenDataGrid @ref="grid" AllowFiltering="true" AllowColumnResize="true" AllowAlternatingRows="false" AllowSorting="true" PageSize="30" AllowPaging="true"
                FilterMode="FilterMode.Advanced" FilterCaseSensitivity="FilterCaseSensitivity.CaseInsensitive" PagerHorizontalAlign="HorizontalAlign.Left"
                ShowPagingSummary="true" Data="@forecasts" Sort="@OnSort" TItem="WeatherForecast" ColumnWidth="90px">
        <Columns>
            <RadzenDataGridColumn TItem="WeatherForecast" Property="Date" Filterable="true" Title="Date" Frozen="true" Width="80px" TextAlign="TextAlign.Center" />
            <RadzenDataGridColumn TItem="WeatherForecast" Property="TemperatureC" Filterable="true" Title="TemperatureC" Frozen="true" Width="80px" TextAlign="TextAlign.Center" />
            <RadzenDataGridColumn TItem="WeatherForecast" Property="TemperatureF" Filterable="true" Title="TemperatureF" Frozen="true" Width="80px" TextAlign="TextAlign.Center" />
            <RadzenDataGridColumn TItem="WeatherForecast" Property="Summary" Filterable="true" Title="Summary" Frozen="true" Width="80px" TextAlign="TextAlign.Center" />
            <RadzenDataGridColumn TItem="WeatherForecast" Property="TemperatureC" Width="80px" Title="" TextAlign="TextAlign.Center" Filterable="false">
                <Template Context="data">
                    @{
                        <RadzenButton ButtonStyle="ButtonStyle.Secondary" Variant="Variant.Flat"
                              Click=@(() => SomeFunction()) Text="Details" />
                    }
                </Template>
            </RadzenDataGridColumn>

        </Columns>
    </RadzenDataGrid>
    <br />
    <RadzenChart>
        <RadzenLineSeries Smooth="false" Data="@forecasts" CategoryProperty="TemperatureC" Title="TemperatureC" LineType="LineType.Solid" ValueProperty="TemperatureC">
            <RadzenMarkers MarkerType="MarkerType.None" />
            <RadzenSeriesDataLabels Visible="false" />
        </RadzenLineSeries>


    </RadzenChart>


@code {
    private IEnumerable<WeatherForecast>? forecasts;
    private RadzenDataGrid<WeatherForecast>? grid;
    protected override async Task OnInitializedAsync()
    {
        forecasts = await ForecastService.GetForecastAsync(DateTime.Now);
        StateHasChanged();
    }
    async Task OnSort(DataGridColumnSortEventArgs<WeatherForecast> args)
    {
        await Task.Yield();
        PropertyInfo property = forecasts.First().GetType().GetProperty(args.Column.Property);
        if (property != null)
        {
            var column = grid.ColumnsCollection.FirstOrDefault(c => c.Property == args.Column.Property);

            if (args.SortOrder == SortOrder.Ascending)
            {
                forecasts = forecasts.OrderBy(item => property.GetValue(item));
            }
            else
            {
                forecasts = forecasts.OrderByDescending(item => property.GetValue(item));
            }

            column.SortOrder = args.SortOrder;
            await grid.Reload();
        }
    }
    async Task SomeFunction()
    {

    }
}
Currently I have been trying to implement custom sorting on the source object, but I can only sort it once and it does not seem to be updated in the chart. After I click on sorting by one column, I can not sort it other way and it remains stuck.
Also, is it possible that whenever I click the button in the grid , to trigger a hover event on the corresponding data point in the chart? (That is why I've included the somefunction method there).
Can somebody shine a light on my situation?
Thank you.
enchev
October 27, 2023, 3:12pm
2
In this case you should bind the Chart to DataGrid View property.
Thank you for your response.
        <RadzenDataGrid @ref="grid" AllowFiltering="true" AllowColumnResize="true" AllowAlternatingRows="false" AllowSorting="true" PageSize="30" AllowPaging="true"
                     FilterMode="FilterMode.Advanced" FilterCaseSensitivity="FilterCaseSensitivity.CaseInsensitive" PagerHorizontalAlign="HorizontalAlign.Left"
                     ShowPagingSummary="true" Data="@forecasts" Sort="@OnSort" TItem="WeatherForecast" ColumnWidth="90px">
        <Columns>
            <RadzenDataGridColumn TItem="WeatherForecast" Property="Date" Filterable="true" Title="Date" Frozen="true" Width="80px" TextAlign="TextAlign.Center" />
            <RadzenDataGridColumn TItem="WeatherForecast" Property="TemperatureC" Filterable="true" Title="TemperatureC" Frozen="true" Width="80px" TextAlign="TextAlign.Center" />
            <RadzenDataGridColumn TItem="WeatherForecast" Property="TemperatureF" Filterable="true" Title="TemperatureF" Frozen="true" Width="80px" TextAlign="TextAlign.Center" />
            <RadzenDataGridColumn TItem="WeatherForecast" Property="Summary" Filterable="true" Title="Summary" Frozen="true" Width="80px" TextAlign="TextAlign.Center" />
            <RadzenDataGridColumn TItem="WeatherForecast" Property="TemperatureC" Width="80px" Title="" TextAlign="TextAlign.Center" Filterable="false">
                <Template Context="data">
                    @{
                        <RadzenButton ButtonStyle="ButtonStyle.Secondary" Variant="Variant.Flat"
                              Click=@(() => SomeFunction()) Text="Details" />
                    }
                </Template>
            </RadzenDataGridColumn>

        </Columns>
    </RadzenDataGrid>
    <br />
    <RadzenChart>
        <RadzenLineSeries Smooth="false" Data="@grid.View" CategoryProperty="TemperatureC" Title="TemperatureC" LineType="LineType.Solid" ValueProperty="TemperatureC">
            <RadzenMarkers MarkerType="MarkerType.None" />
            <RadzenSeriesDataLabels Visible="false" />
        </RadzenLineSeries>


    </RadzenChart>
I have done this modifications and the chart does not get updated whenever I put filters in datagrid.
Can anybody explain please?
enchev
November 6, 2023, 1:26pm
5
Try to call Chart Reload() method on DataGrid Filter event.
enchev:
on
This does not work.
korchev
November 29, 2023, 2:43pm
7
We offer dedicated customer support as part of the Radzen Blazor Studio subscription. You may consider this option if you need us to check your application.
Thank you for your prompt response, and please excuse my approach if it was inappropriate.
korchev
November 29, 2023, 2:56pm
9
peter895:
This does not work.
This is your last comment. What does not work?
What sort issue?
Calling chart.Reload() on filter event. This does not reset the view of the chart. Also setting the data source for the chart as grid.View() does not get updated.
korchev:
What sort issue?
peter895:
Currently I have been trying to implement custom sorting on the source object, but I can only sort it once and it does not seem to be updated in the chart. After I click on sorting by one column, I can not sort it other way and it remains stuck.
I can only click on the column to sort it once. Then it remains "stuck" like that, and it does not matter how many times I click it.
korchev
November 29, 2023, 3:27pm
11
The chart will update only if the Data series parameter has changed. Check your implementation if this is the case.
Thank you very much for your response.
korchev
November 29, 2023, 6:27pm
13
No idea what this means.
Same as filtering. But have in mind that RadzenChart sorts its data by category in some cases.
korchev:
No idea what this means.
That means I have applied a filter on the forecasts collection, from the UI.
korchev
November 30, 2023, 6:41am
15
I give up
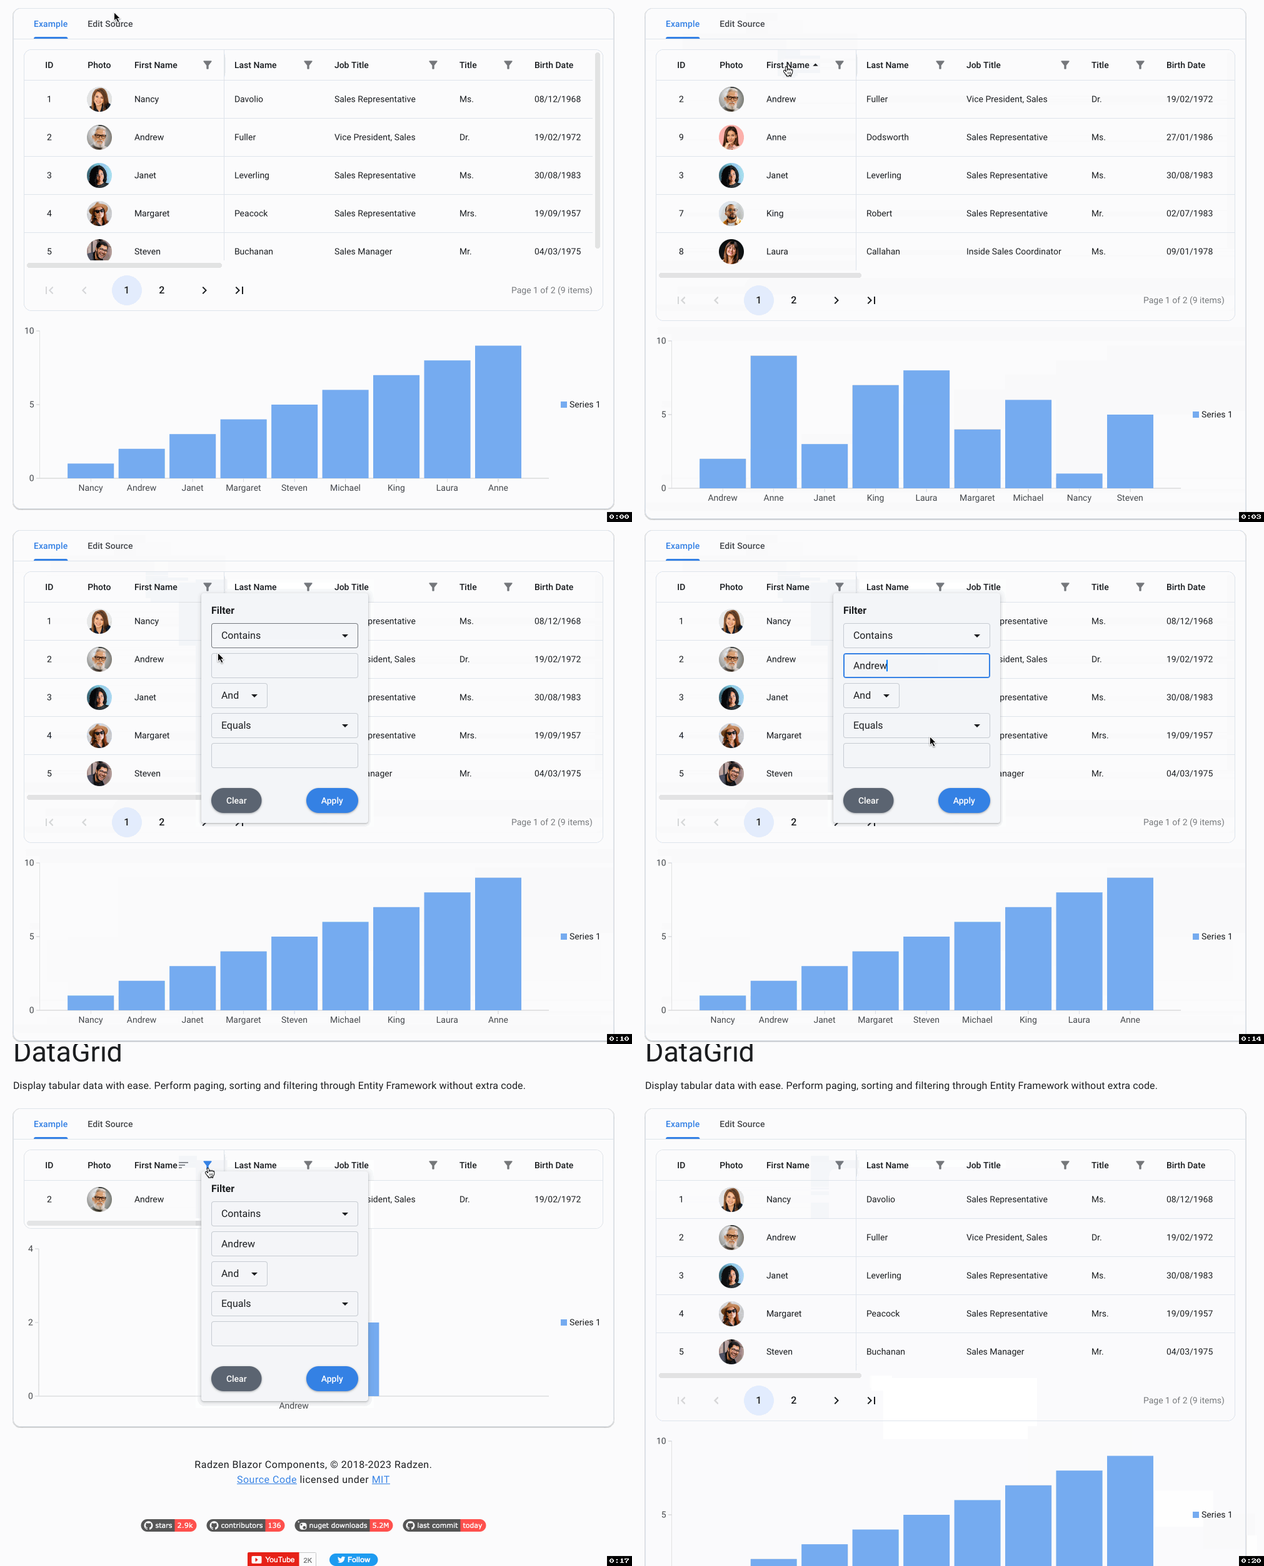
For what is worth here is a working example based on our online demo :
<RadzenDataGrid @ref="grid" Sort="@OnDataChange" Filter="@OnDataChange" FilterCleared="@OnDataChange" AllowFiltering="true" AllowColumnResize="true" AllowAlternatingRows="false" FilterMode="FilterMode.Advanced" AllowSorting="true" PageSize="5" AllowPaging="true" PagerHorizontalAlign="HorizontalAlign.Left" ShowPagingSummary="true"
    Data="@employees" TItem="Employee" ColumnWidth="300px" LogicalFilterOperator="LogicalFilterOperator.Or">
    <Columns>
        <RadzenDataGridColumn TItem="Employee" Property="EmployeeID" Filterable="false" Title="ID" Frozen="true" Width="80px" TextAlign="TextAlign.Center" />
        <RadzenDataGridColumn TItem="Employee" Title="Photo" Frozen="true" Sortable="false" Filterable="false" Width="80px" TextAlign="TextAlign.Center" >
            <Template Context="data">
                <RadzenImage Path="@data.Photo" class="rz-gravatar" />
            </Template>
        </RadzenDataGridColumn>
        <RadzenDataGridColumn TItem="Employee" Property="FirstName" Title="First Name" Frozen="true" Width="160px" />
        <RadzenDataGridColumn TItem="Employee" Property="LastName" Title="Last Name" Width="160px"/>
        <RadzenDataGridColumn TItem="Employee" Property="Title" Title="Job Title" Width="200px" />
        <RadzenDataGridColumn TItem="Employee" Property="TitleOfCourtesy" Title="Title" Width="120px" />
        <RadzenDataGridColumn TItem="Employee" Property="BirthDate" Title="Birth Date" FormatString="{0:d}" Width="160px" />
        <RadzenDataGridColumn TItem="Employee" Property="HireDate" Title="Hire Date" FormatString="{0:d}" Width="160px" />
        <RadzenDataGridColumn TItem="Employee" Property="Address" Title="Address" Width="200px" />
        <RadzenDataGridColumn TItem="Employee" Property="City" Title="City" Width="160px" />
        <RadzenDataGridColumn TItem="Employee" Property="Region" Title="Region" Width="160px" />
        <RadzenDataGridColumn TItem="Employee" Property="PostalCode" Title="Postal Code" Width="160px" />
        <RadzenDataGridColumn TItem="Employee" Property="Country" Title="Country" Width="160px" />
        <RadzenDataGridColumn TItem="Employee" Property="HomePhone" Title="Home Phone" Width="160px" />
        <RadzenDataGridColumn TItem="Employee" Property="Extension" Title="Extension" Width="160px" />
        <RadzenDataGridColumn TItem="Employee" Property="Notes" Title="Notes" Width="300px" />
    </Columns>
</RadzenDataGrid>
<RadzenChart>
   <RadzenColumnSeries Data="@chartData" CategoryProperty="FirstName" ValueProperty="EmployeeID" />
</RadzenChart>
@code {
    IEnumerable<Employee> employees;
    IEnumerable<Employee> chartData;
    RadzenDataGrid<Employee> grid;

    void OnDataChange()
    {
       chartData = grid.View;
    }

    protected override async Task OnInitializedAsync()
    {
        await base.OnInitializedAsync();

        employees = dbContext.Employees;
        chartData = employees;
    }
}
1 Like
This is exactly what I was looking for.
