The ColumnSeries and LineSeries chart won't show all their data points in a Bootstrap layout with other charts present. I created a .razor component that shows the problem.
Here is what the bar chart looks like (there is data going all the way through September 22):
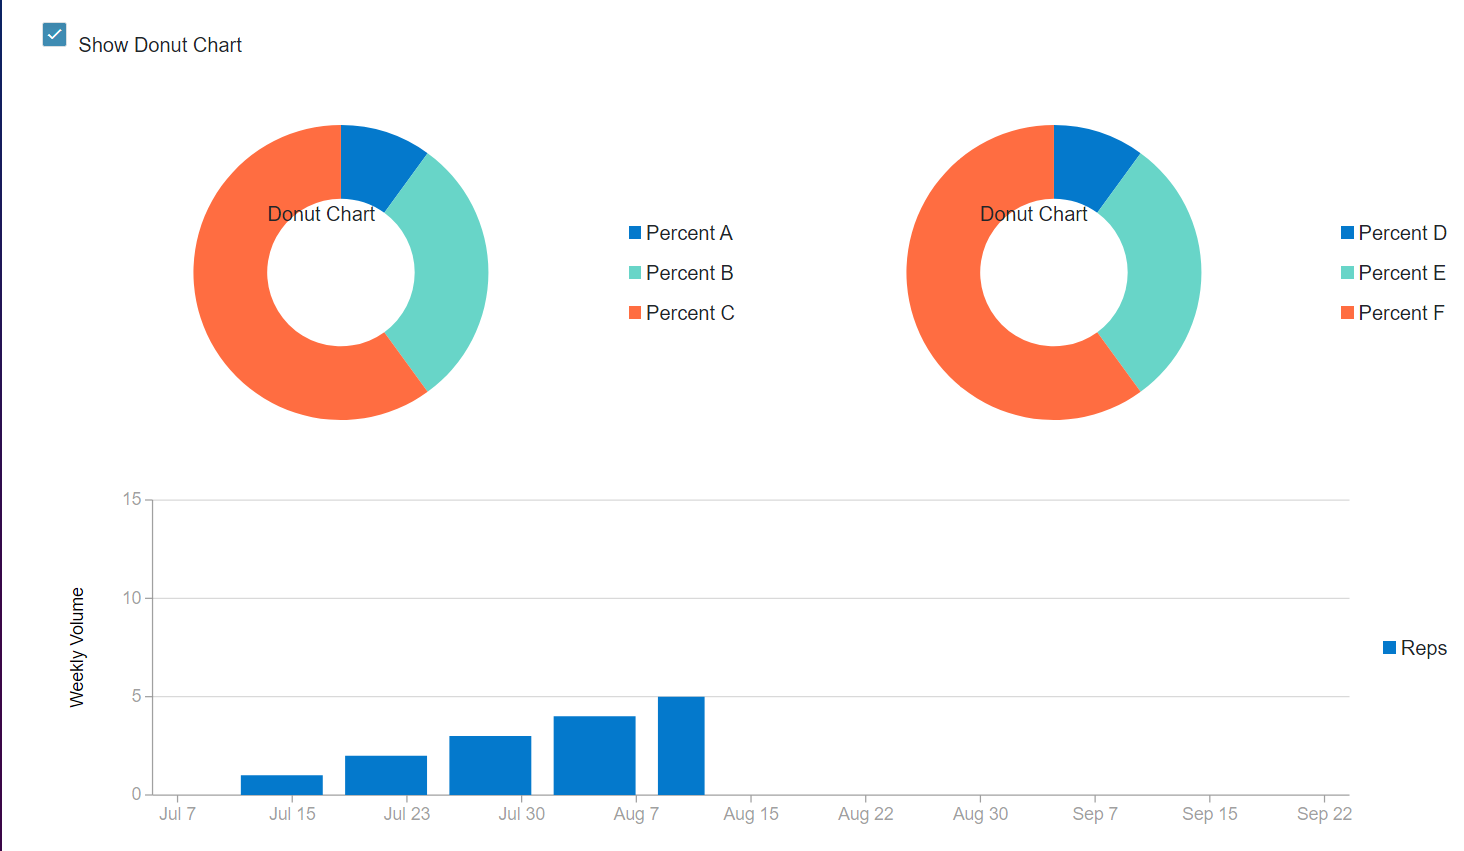
If reverse the order of the rows, all the bars show in the column series. Index.razor:
@page "/"
<RadzenCheckBox @bind-Value="@_showDonutChart" Style="margin-bottom: 20px" TValue="bool" />
<RadzenLabel Text="Show Donut Chart" Style="margin-left: 5px;margin-bottom: 20px" />
<div class="container">
	@if( _showDonutChart )
	{
		<div class="row">
			<div class="col">
				<RadzenChart>
					<RadzenDonutSeries Data="@_percents"
											 CategoryProperty="Title"
											 ValueProperty="PercentVolume">
						<TitleTemplate>
							Donut Chart
						</TitleTemplate>
					</RadzenDonutSeries>
				</RadzenChart>
			</div>
			<div class="col">
				<RadzenChart>
					<RadzenDonutSeries Data="@_percents2"
											 CategoryProperty="Title"
											 ValueProperty="PercentVolume">
						<TitleTemplate>
							Donut Chart
						</TitleTemplate>
					</RadzenDonutSeries>
				</RadzenChart>
			</div>
		</div>
	}
	<div class="row">
		<div class="col">
			<RadzenChart>
				<RadzenColumnSeries Data="@_weeklyVolumes"
										  CategoryProperty="Date"
										  Title="Reps"
										  LineType="LineType.Dashed"
										  ValueProperty="Reps">
					<RadzenMarkers MarkerType="MarkerType.Square" />
				</RadzenColumnSeries>
				<RadzenCategoryAxis Padding="20" FormatString="{0:MMM d}" />
				<RadzenValueAxis>
					<RadzenGridLines Visible="true" />
					<RadzenAxisTitle Text="Weekly Volume" />
				</RadzenValueAxis>
			</RadzenChart>
		</div>
	</div>
</div>
@code{

	private bool _showDonutChart = true;
	private DataItem[] _weeklyVolumes = new DataItem[0];

	class DataItem
	{
		public DateTime Date { get; set; }
		public double Reps { get; set; }
		public DataItem( DateTime date, int reps )
		{
			Date = date;
			Reps = reps;
		}
	}
	class DonutItem
	{
		public string Title{ get;set; }
		public double PercentVolume{get;set;}
	}

	private DonutItem[] _percents = new DonutItem[]{
			new DonutItem{Title = "Percent A", PercentVolume = 10.0 },
			new DonutItem{Title = "Percent B", PercentVolume = 30.0 },
			new DonutItem{Title = "Percent C", PercentVolume = 60.0 }
	};

	private DonutItem[] _percents2 = new DonutItem[]{
			new DonutItem{Title = "Percent D", PercentVolume = 10.0 },
			new DonutItem{Title = "Percent E", PercentVolume = 30.0 },
			new DonutItem{Title = "Percent F", PercentVolume = 60.0 }
	};

	//Creates sample column chart data.
	private void CreateWeeklyVolumes()
	{
		var items = new List<DataItem>();
		const int TOTAL_WEEKS = 12;
		const int ONE_WEEK = 7;
		var date = DateTime.Now;
		for( var i = 0; i < TOTAL_WEEKS; i++ ){
			date = date.AddDays( ONE_WEEK );
			items.Add( new DataItem(date, i ) );
		}
		_weeklyVolumes = items.ToArray();
	}

	protected override void OnInitialized()
		=> CreateWeeklyVolumes();
}