When creating a column chart the data from the same category are very spread out. This causes the last item to appear as though they are a part of the next category; as the normal behavior I would expect would be the data with matching categories to be closer. Is there a property to adjust this?
To fix this behavior: in the RadzenColumnOptions set the Margin to something (for me 1 worked nicely.)
There to my knowledge no documentation on this property, same with Radius and padding (for RadzenCategoryAxis).
But I had another question that pertains to spacing: Is there a way to display one set of data with the legend having each category as a title (for the clicking to disable functionality). The best example of this I can think of is your Pie Chart, how in the legend it displays each category in a list. The only way I have been able to do it is in a foreach loop and creating a new list for each item because Data takes an IEnumerable. This has the consequence of every item being super spaced out. And for the first Element not to be displayed.
The only other option I see is to have them in one list as normal but then the legend will only display 1 item representing the whole dataset.
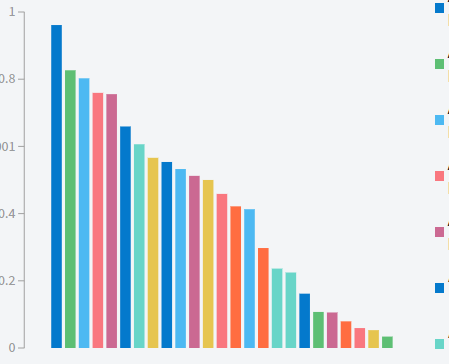
Example picture:
This isn't currently supported. You can set the Fills property of the series to make them use a different color but they will not appear as separate items in the legend.
Essentially set the padding of the category axis high to bring the columns closer than I changed the stroke width to make the columns a bit thicker to see.
I had to use my own property for the colors because after the 8th column their color wheel ends and it displays the rest of them as black instead of repeating the colors (I used the same colors they have by default) (I realize some of the colors repeat next to each other that is because I lazily set the colors based on order of object creation).
I had to set the fill and stroke property because they deal with different parts of the column (inside and outside respectably).