Chart value axis step

Hi,

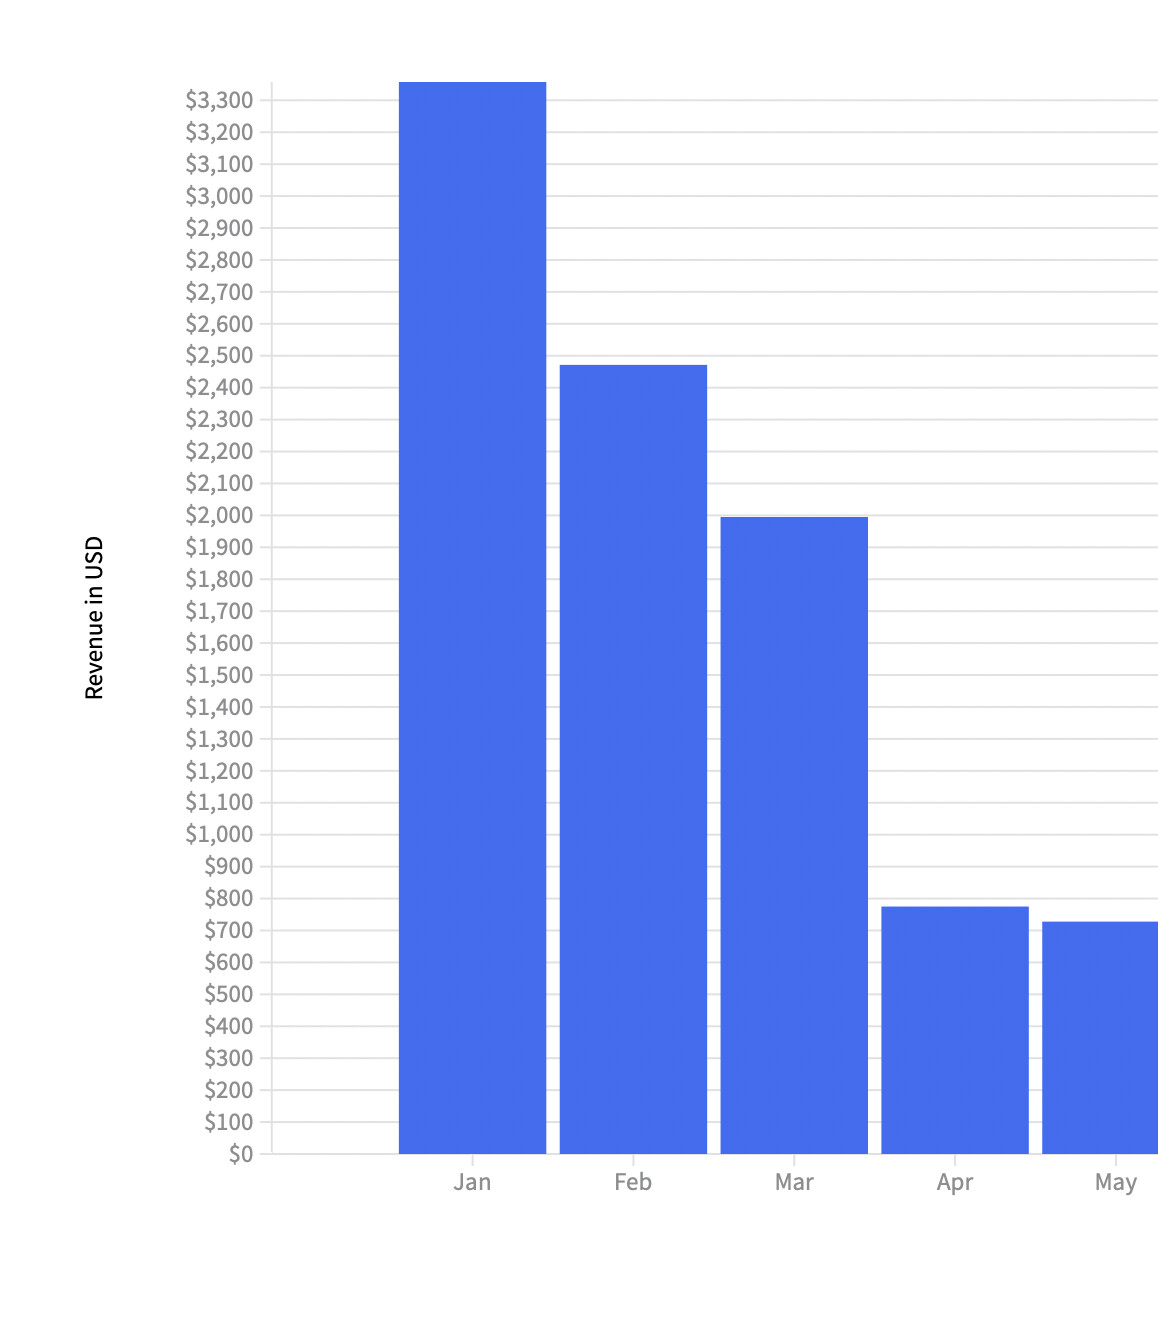
I have a list of (Month,Dollars) and I want to show a column chart of dollars spent each month. I want the chart to display a horizontal grid line every 100 dollars on the value axis. How do I use the Step property? If I set Step to 100 I get uneven numbers. How do I get the chart to display ticks on even numbers like 100 200 300 etc.? Thanks!
image

Hi @glut,

This is definitely not normal. What values are you using?

Here is my grid declaration. My data is KeyValuePair<string, decimal>

What are the actual series values that you are displaying?

Here is a comma separated list, thanks!

3357.2842857142857142857142857,2471.41,1995.0,775.0,727.7595,696.5345,695.48555555555555555555555556,671.6825,596.44368421052631578947368421,421.06210526315789473684210526

You can try setting the Min property of the axis too. Here is what happens when I set it to 0.

1 Like