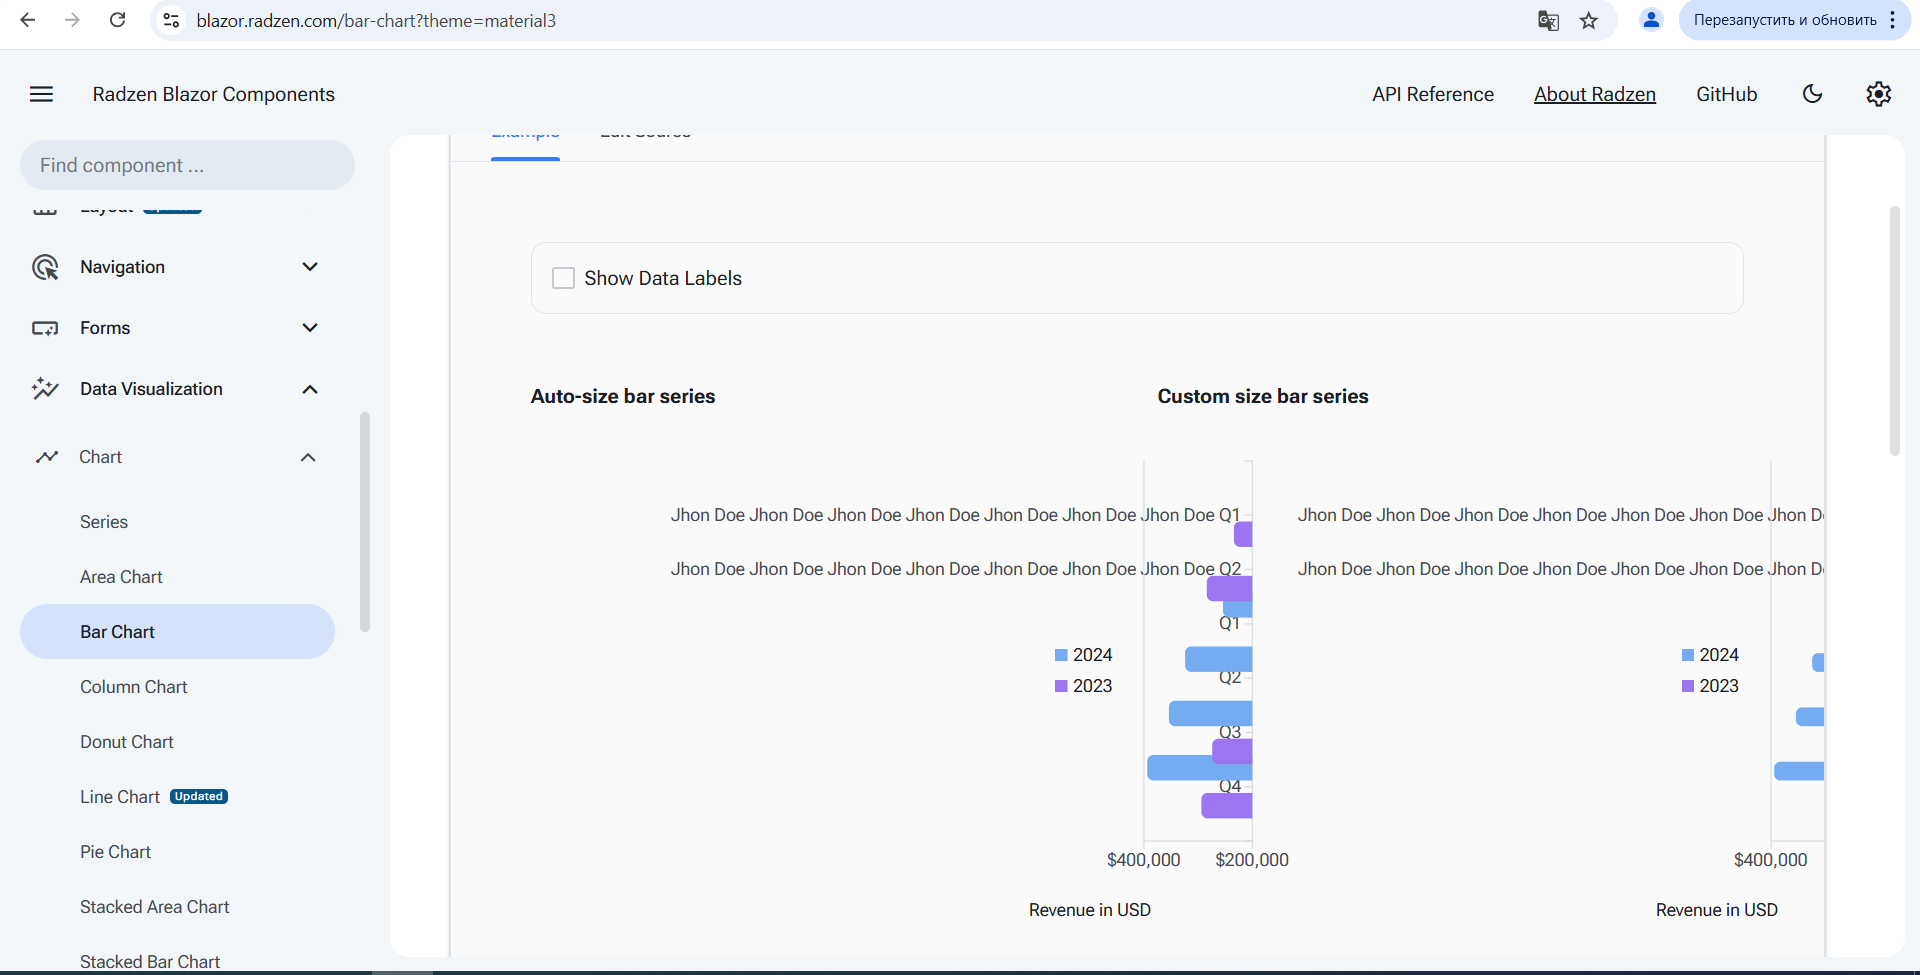
Hi everyone! I need to use bar chart to display some data. But I faced with one issue. I've long enough text for axis in my case and it's take almost all width of svg. And thats why chart become unclear. My client wants it to be fully displayed on the page with chart.
I've tried to reproduce this on demo and have the same problem as on my side. Is there any way too add text-wrap or something?