Hello there, I am using multiple line series in my chart component and I have come across a weird response from the Chart's tooltip, if it so happend that one lineseries intersects the other/others, the tooltip will not be show for those.
Here's an example:
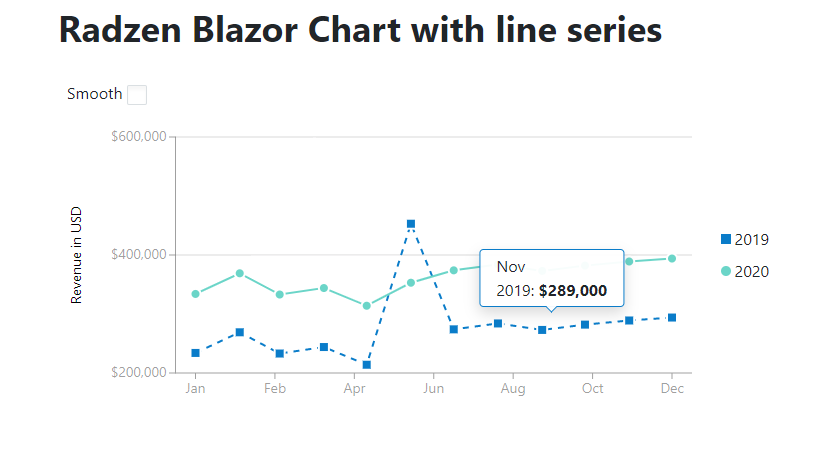
Should the screenshot not work, i will describe the changes I made. I went into the Line Chart Series example and under the 2019 dataset i changed the Revenue value for Date("2019-06-01") to 453.000 so that it would intersect dataset 2020. What happens here is, now i can only see the tooltip for the 2019 dataset while it would seem that 2020 is hidden behind 2019.
Thanks in advance!