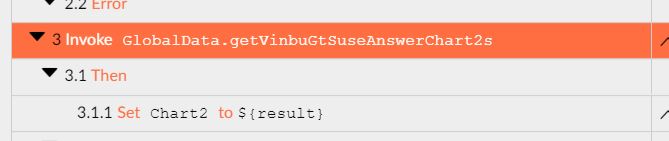
When I bind a bar chart to a datasource, I can hover over the bar and see the value. If i invoke the data source, filter it, bind the result to a property and then bind the chart to the property, the values are missing.
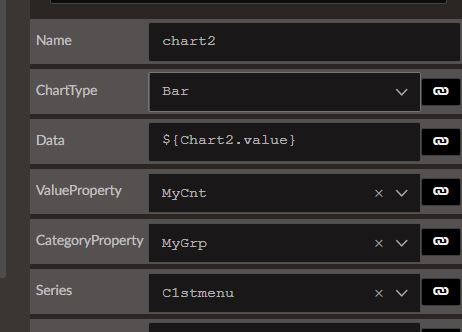
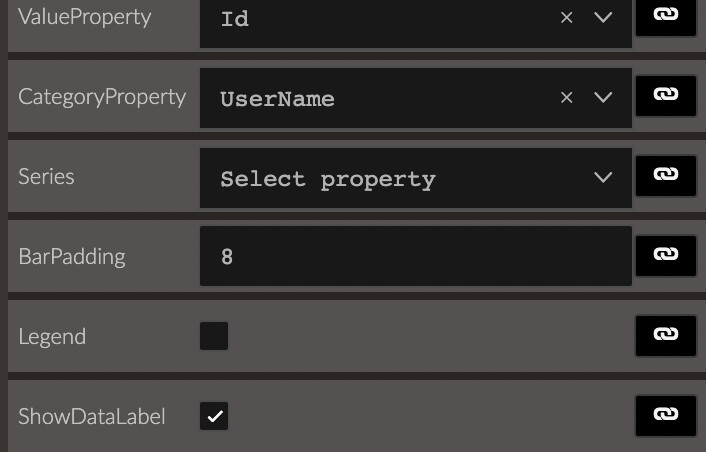
Here are the properties, if possible, it would be preferred to have the data displayed at all times, not just when hovering over the bar.
Hi @JUN,
We are not aware of suck problem. Setting the Data property of the chart should make it display the series no matter the origin of the data. Can you confirm that the property value is not empty? You can check your browser's developer tools for that (the network tab).
I checked the properties and they are correct. I deployed the app again and now the values are visible when hovering. Is it possible to have the values displayed at all times?
Thank you
I am not sure I understand this. Can you clarify? What values do you mean?
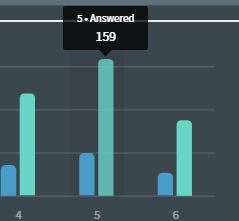
when you position the cursor over the bar, you see the value. Is it possible to have the value displayed at all times, not just when the cursor is positioned over the bar. We would like to see the actual value of the datapoint. Thank you.
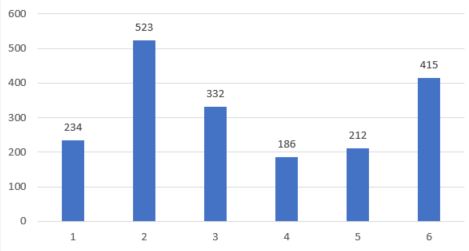
Something like this is the desired result
I see what you mean @JUN.
At the moment this isn't supported however we will expose it as a property in the next Radzen release (due next week). It will be called ShowDataLabel and be unchecked by default.
That will be excellent, thank you!
Hi korchev, I have installed the update and the datalabel property works perfectly. I do have one issue, I am using a dark theme and it looks like the ShowDataLabel font is only in black, is there a way to change/alter the font color for ShowDataLabel? Thank you.
You can use the following CSS rule to set the color of the values:
.chart .textDataLabel {
  fill: white;
}
Append that code to the client\src\styles.css file of your Radzen application.
That worked perfectly, thank you