Hello -
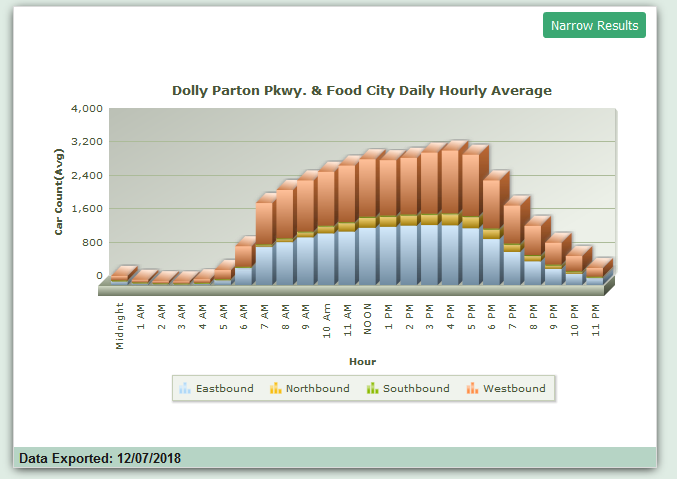
I was wondering if it is possible to create Analytical Bar Charts - showing more than one thing on an axis at a time. I have attached an image of one of the charts We created with our current application development tool. I would really like to be able to do this with RadZen so we can replace this tool.
Any help is appreciated.
Hi @eblumberg,
Is this Analytical Bar Chart similar to this one (stacked bar chart) or does it have more features? If the linked demo is what you need we can add support for it in Radzen.
1 Like
Yes. Thank you for your fast reply.
That's exactly what I was talking about. Wasn't sure what to call it - that's what it was called in the other development platform.
Basically we have multiple Approach Types per Intersection (North, South, East, and West) and we need to show all 4 of them at the same time based on SQL Server data.
I would love to be able to make "stacked" charts of different types as well for some variation.
Is there a way to do this with Radzen now? Is there something I can do to make this currently, or are you adding it to the next update?
Thanks for your help in this. You guys are amazing! 
Stacked charts are currently not supported in Radzen. We would have to implement support for stacking in order for you to use it.
How quickly do you think you might be able to implement this? If I can get this working, I could probably get my superiors to make this purchase.
So far, everything I'm seeing here is excellent, but this is something they would want.
Thanks again for your excellent support.
I got it going using ngx-charts in just a few steps
-
Create a Radzen angular application and add a page
-
Run the application so that it generates its code and stop it
-
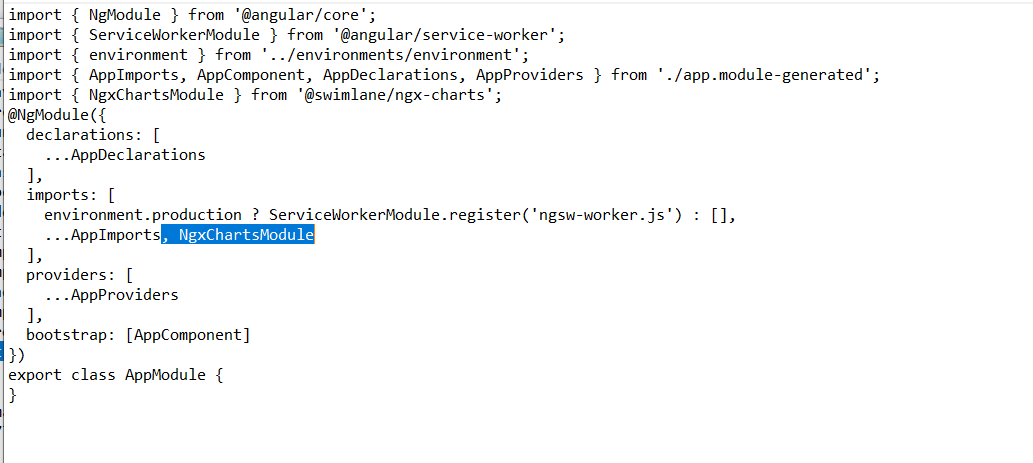
Open app.module.ts in notepad it is in the following path radzen-app-dir\client\src\app\app.module.ts
Add the following to the file and save it
At the top add
import { NgxChartsModule } from '@swimlane/ngx-charts';
under @NgModule
imports: add , NgxChartsModule
It should look something like this
-
Go to the main page
-
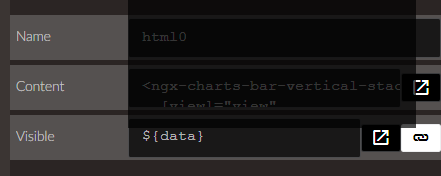
Drag and drop a Html component and add the following code
<ngx-charts-bar-vertical-stacked
[view]="view"
[scheme]="colorScheme"
[results]="data"
[gradient]="gradient"
[xAxis]="showXAxis"
[yAxis]="showYAxis"
[legend]="showLegend"
[showXAxisLabel]="showXAxisLabel"
[showYAxisLabel]="showYAxisLabel"
[xAxisLabel]="xAxisLabel"
[yAxisLabel]="yAxisLabel"
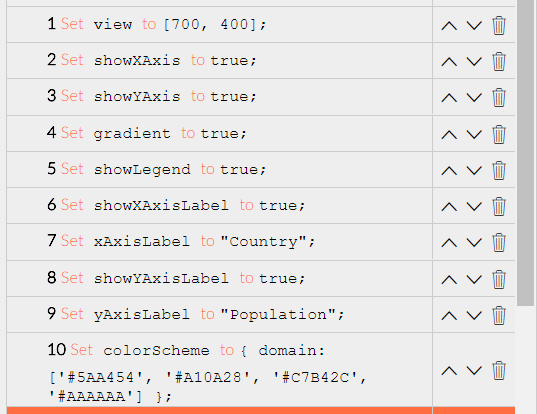
- Add the following to the page load event
These are the setting for the chart and can be found at Stacked Vertical Bar Chart | ngx-charts
-
Next add the datasource I just set a variable called data with the following
[
{
"name": "Germany",
"series": [
{
"name": "2010",
"value": 7300000
},
{
"name": "2011",
"value": 8940000
}
,
{
"name": "2012",
"value": 8940000
}
]
},
{
"name": "USA",
"series": [
{
"name": "2010",
"value": 7870000
},
{
"name": "2011",
"value": 8270000
},
{
"name": "2012",
"value": 8940000
}
]
},
{
"name": "France",
"series": [
{
"name": "2010",
"value": 5000002
},
{
"name": "2011",
"value": 5800000
},
{
"name": "2012",
"value": 8940000
}
]
}
];
-
Next set the visible property of the html control to ${data}
-
Now run the application and you should get a chart like....
The only thing left is to change the data variable to your datasource and change it to the structure as above which the chart expects.
3 Likes
That would be neat though. Stacking is key when aiming at use charts from a management (ie sales) perspective.