ipe
December 15, 2020, 11:13am
1
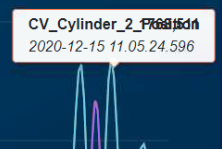
There is overlap in the line chart tooltip text when all of the following apply:
The text is long
There are two bootstrap columns in the tooltip
The tooltip is close to the right edge of the screen
It appears that the maximum width of the tooltip is limited when near the right edge of the screen, and this causes the problem.
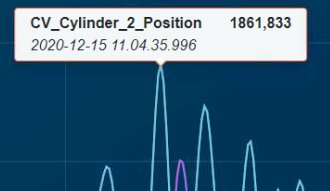
Please see the screenshots below for an example of the overlap and what it normally looks like.
ipe
December 15, 2020, 11:18am
2
The tooltip template I use is as follows:
<TooltipTemplate Context="data">
    <div class="row">
        <div class="col-6"><strong>@data.Graph.Tag</strong></div>
        <div class="col-6 text-right"><strong>@data.Value.ToString("F3")</strong></div>
    </div>
    <div class="row">
        <div class="col"><i>@data.Timestamp.ToString("yyyy-MM-dd HH:mm:ss.fff")</i></div>
    </div>
</TooltipTemplate>
korchev
December 15, 2020, 12:02pm
3
This is how Bootstrap rows and cols behave - they occupy the available space. You can try setting some minimal width to a parent element within the tooltip template.
<TooltipTemplate Context="data">
    <div style="width: 400px">
    <div class="row">
        <div class="col-6"><strong>@data.Graph.Tag</strong></div>
        <div class="col-6 text-right"><strong>@data.Value.ToString("F3")</strong></div>
    </div>
    <div class="row">
        <div class="col"><i>@data.Timestamp.ToString("yyyy-MM-dd HH:mm:ss.fff")</i></div>
    </div>
   </div>
</TooltipTemplate>
ipe
December 15, 2020, 12:21pm
4
Yes, correct, that works. Thanks once again!